ICT Mentorship 2022
This is my ICT 2022 Mentorship notes.
2022
Learning Plan:
- ICT 2022 Mentorship
- FVG
- Power Of Three
- Bias
- Risk Management
- Money Management
- ICT Silve Bullet
- Optimal Trade Entry (OTE)
- Mastering High Probability Scalping
- Directional Bias
- PO3
- Reversal
- Money Management
- Market Maker Series
- Who is MM?
- Bias
- Sniper Forex Series
Market Maker Series (2021)
- Central Banks - are Market Makers
- Dealers like Chase, BofA, Citi or Goldman Sachs, etc - are not Market Makers
- Brokers like TD Ameritrade, Charles Schwab, etc - are not Market Makers
Bias
To have an idea where is market is goling to go we need a Bias. So how to get that Bias?
Quantitative Analysis (objective)
First we can make a Quantitative Analysis:
- Global Interest Rates on global-rates.com. Important here is: Interest Rates Differentials - which country you will choose to place your money? with 2% interest rates or with 5%? Obviously you will choose higher yield interest rates... Central Banks thinks similarly but with some differentials... So if USD or CAD interest rates are higher (0.25%) than for example JPY (Japaneese Yen) and COT (commercials) are Bullish on USD or CAD and Bearish on JPY, then we can anticipate rallie on USD/JPY and CAD/JPY currency pairs... And it's not just 1D Bias, it's long run
- Commitment Of Traders (COT) on barchart.com. We are mostly interesting on commercials - Bullish is when COT commercials (Red color) indicator on a Asset is above zero, otherwise it's Bearish when COT commercials Red colored indicator line is below 0
Institutional Order Flow & Liquidity
When we know where market is going to go on a high level, we would likw to figureout where it's going to go next weak or days. So how to get that information?
Qualitative Analysis (subjective)
- If Market price is going Higher - we can expect that it may draw on Buystop Liquidiry and then:
- Continue go Higher to draw on Higher Buy Stops Liquidity (too clean, double tops, etc)
- Continue go Higher to rebalance BISI FVG which was previously form Higher
- Continue go Higher to make a Higher High
- Do reversal to move Lower to draw on Sellstop Liquidity in nearest future
- Or stay for consolidation
- If Market price is going Lower - we can expect that it may draw on Sellstop Liquidiry and then:
- Continue go Lower to draw on Lower Sellstop Liquidity (too clean, double tops, etc)
- Continue go Lower to rebalance SIBI FVG which was previously form Lower
- Continue go Lower to make a Lower Low
- Do reversal to move Higher to draw on Buystop Liquidity in nearest future
- Or stay for consolidation
Market Maker Buy Model (MMBM)
Possible Lows formations:
- Regular: Low then Lower Low => +Breaker or 2) Only with SMT Divergence: Low then Higher Low => +OB / +FVG / +OTE
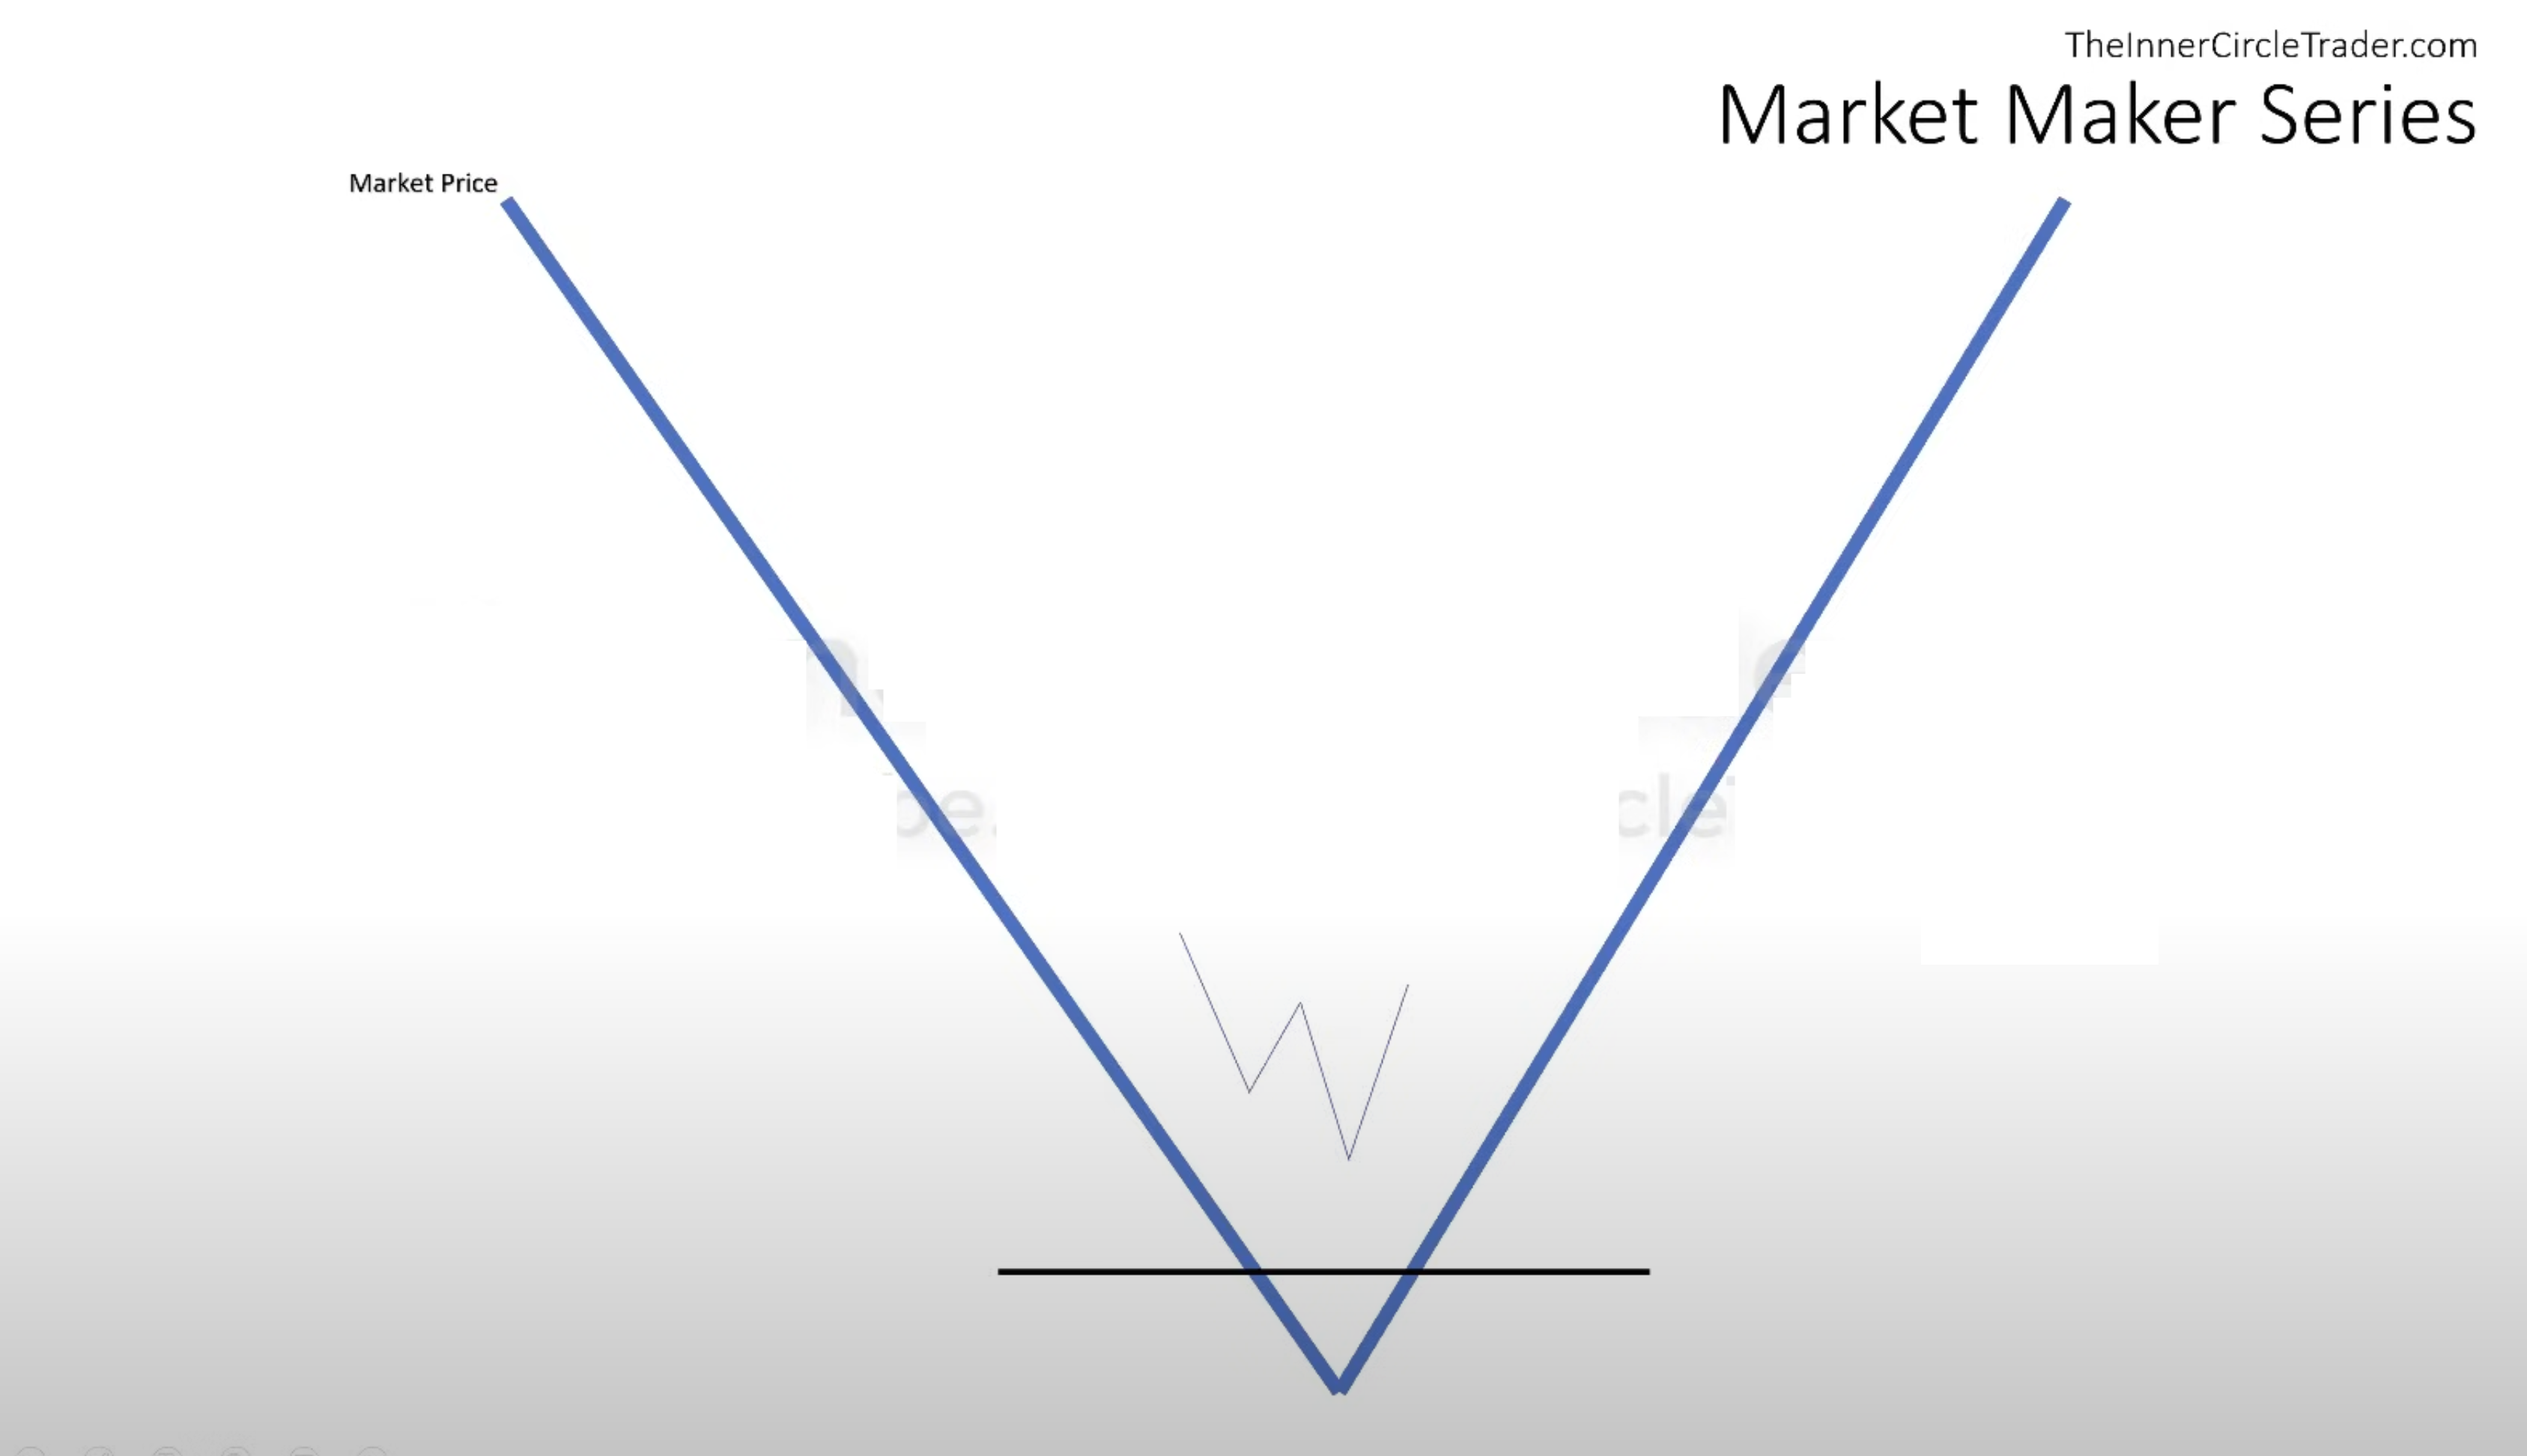
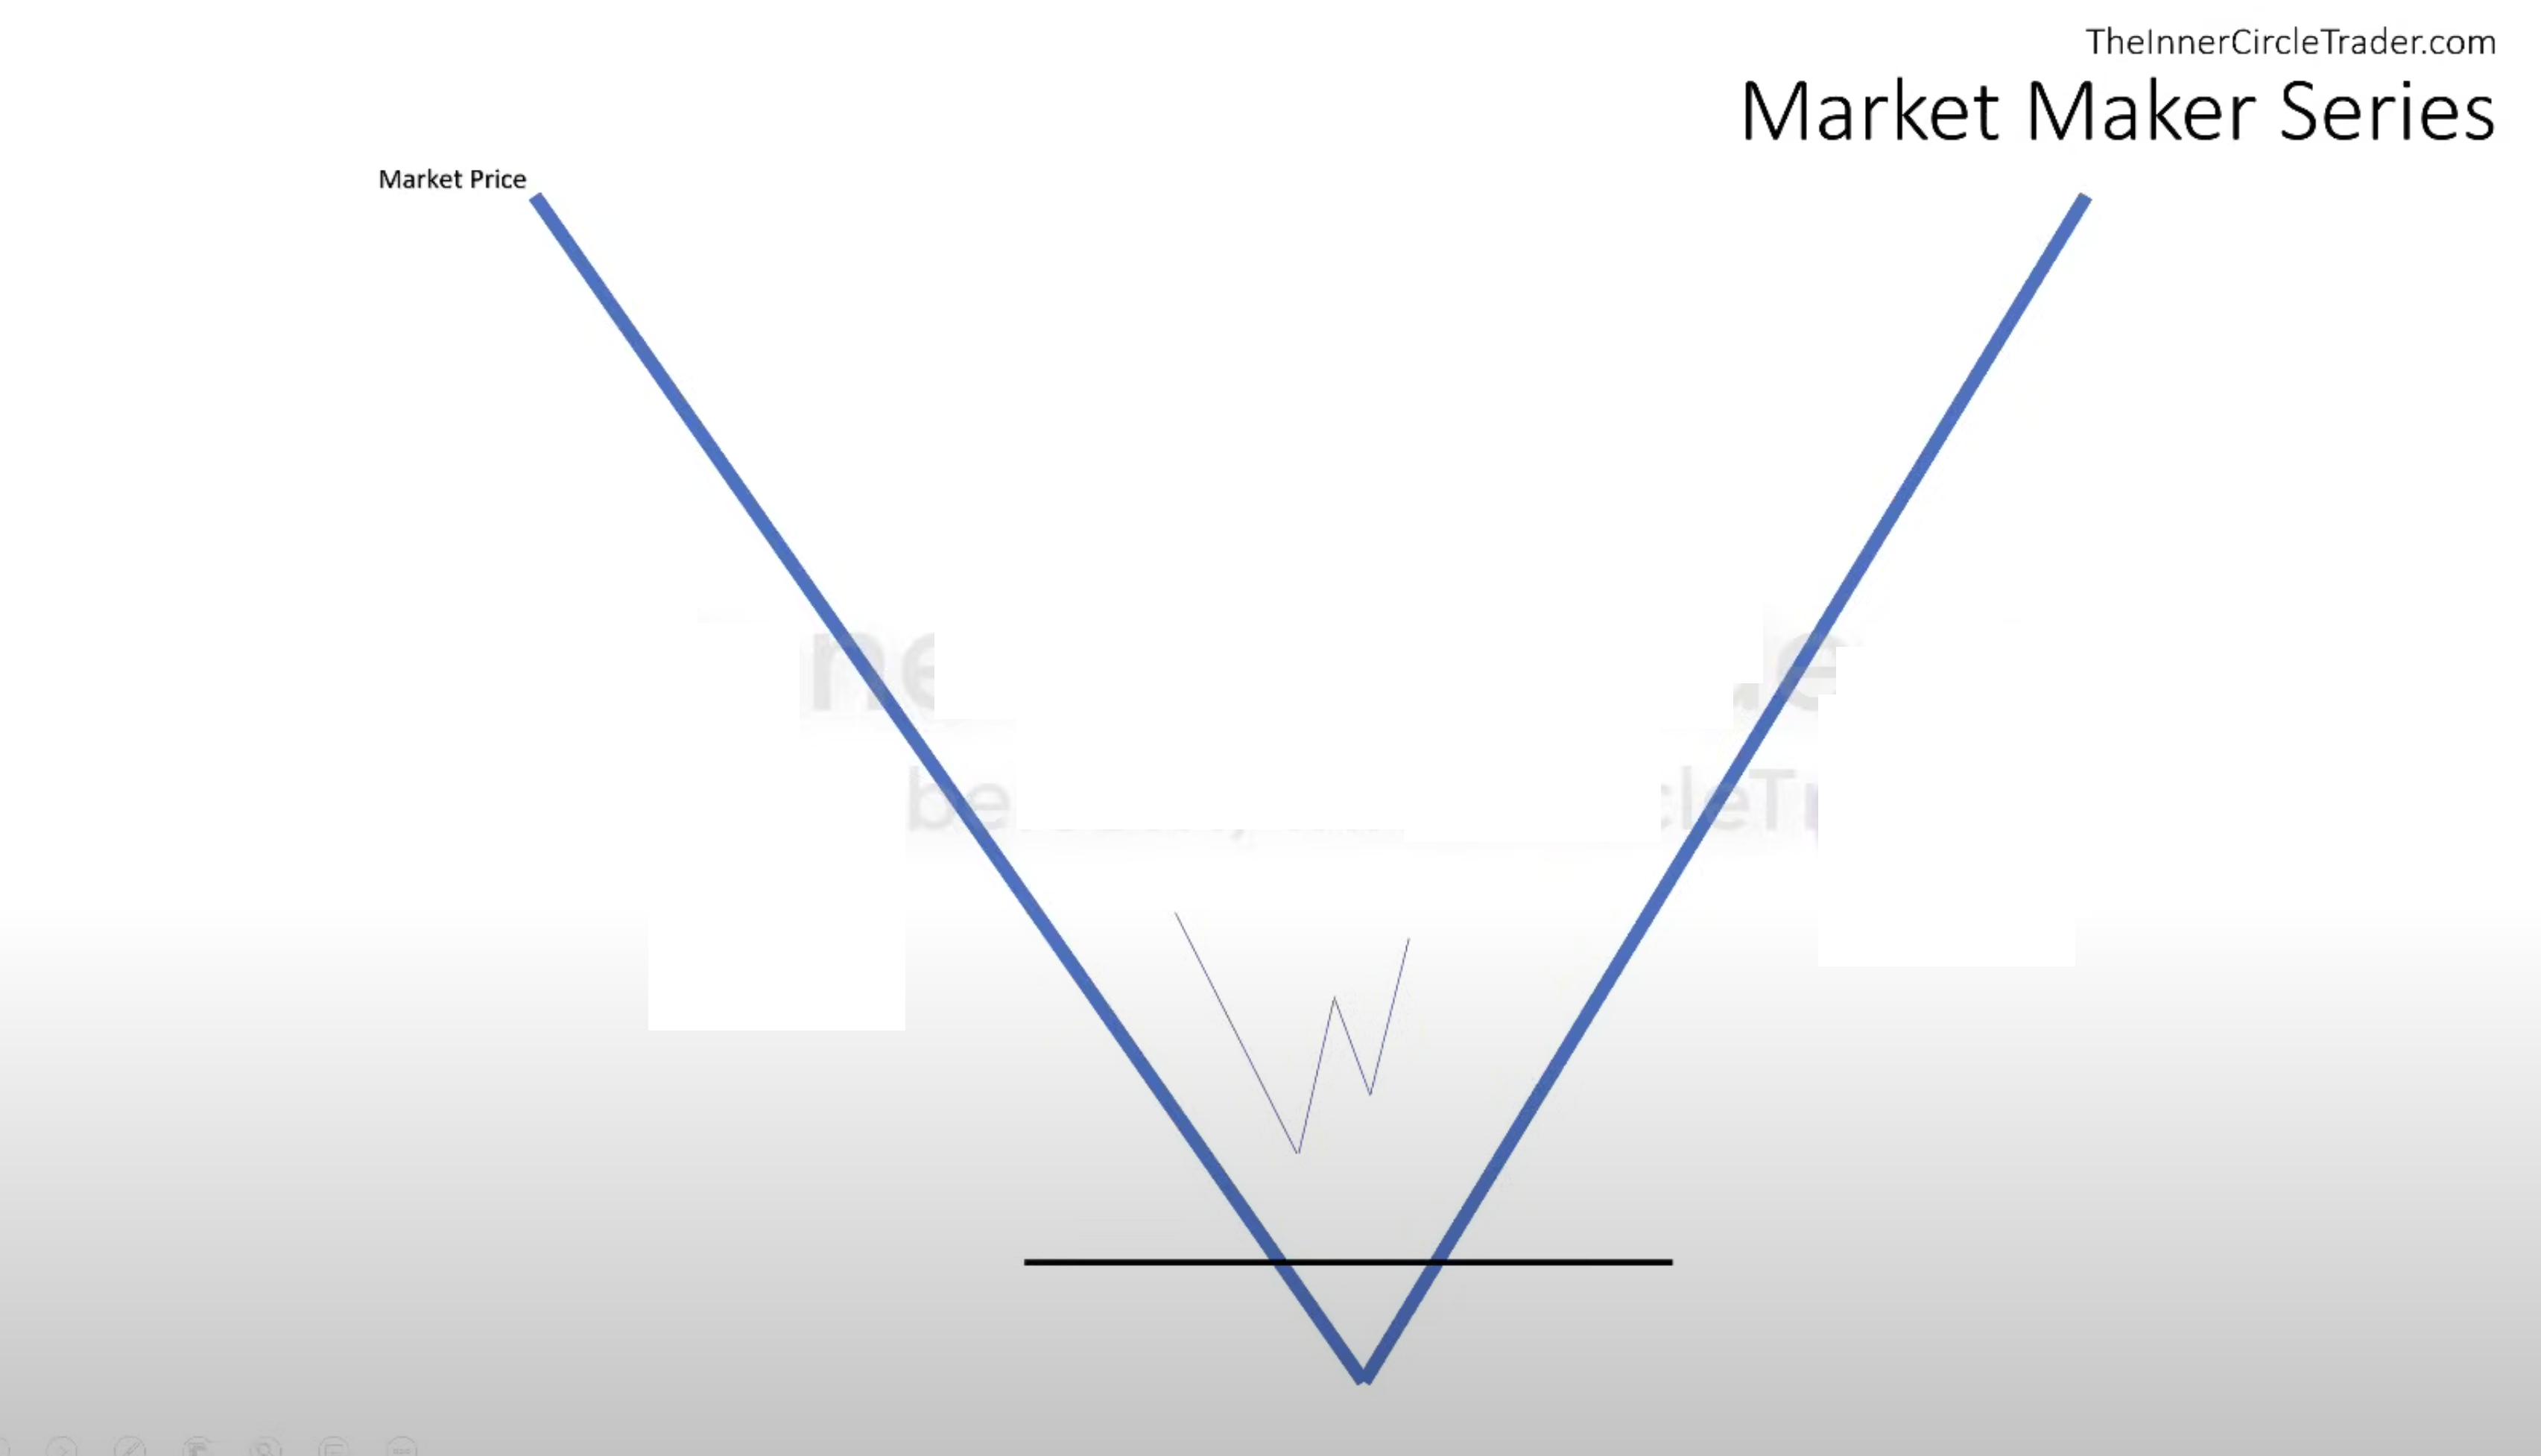
Model starts from Short Term Consolidation or Short Term Trading Range - when price is staying in range some time. For example on a 15m TF it could be 5-10 candels (it's depends)
Mastering High Probability Scalping (2017)
ICT Directional Bias For Sculping
See this ICT - Mastering High Probability Scalping Volumes 1 - 3 YouTube playlist
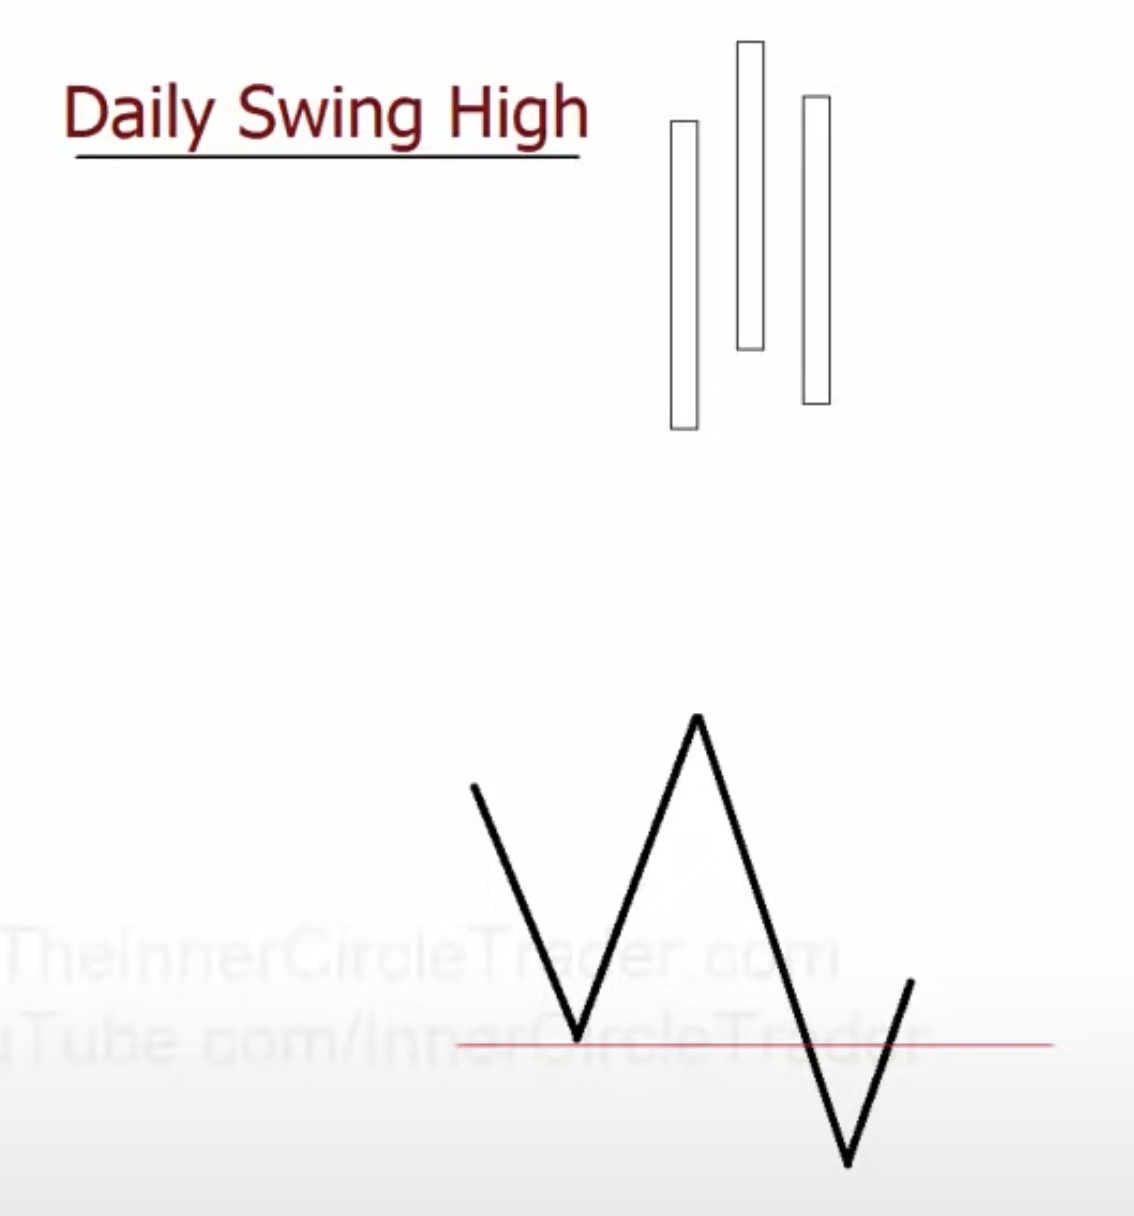
Implementing Bullish Daily Bias
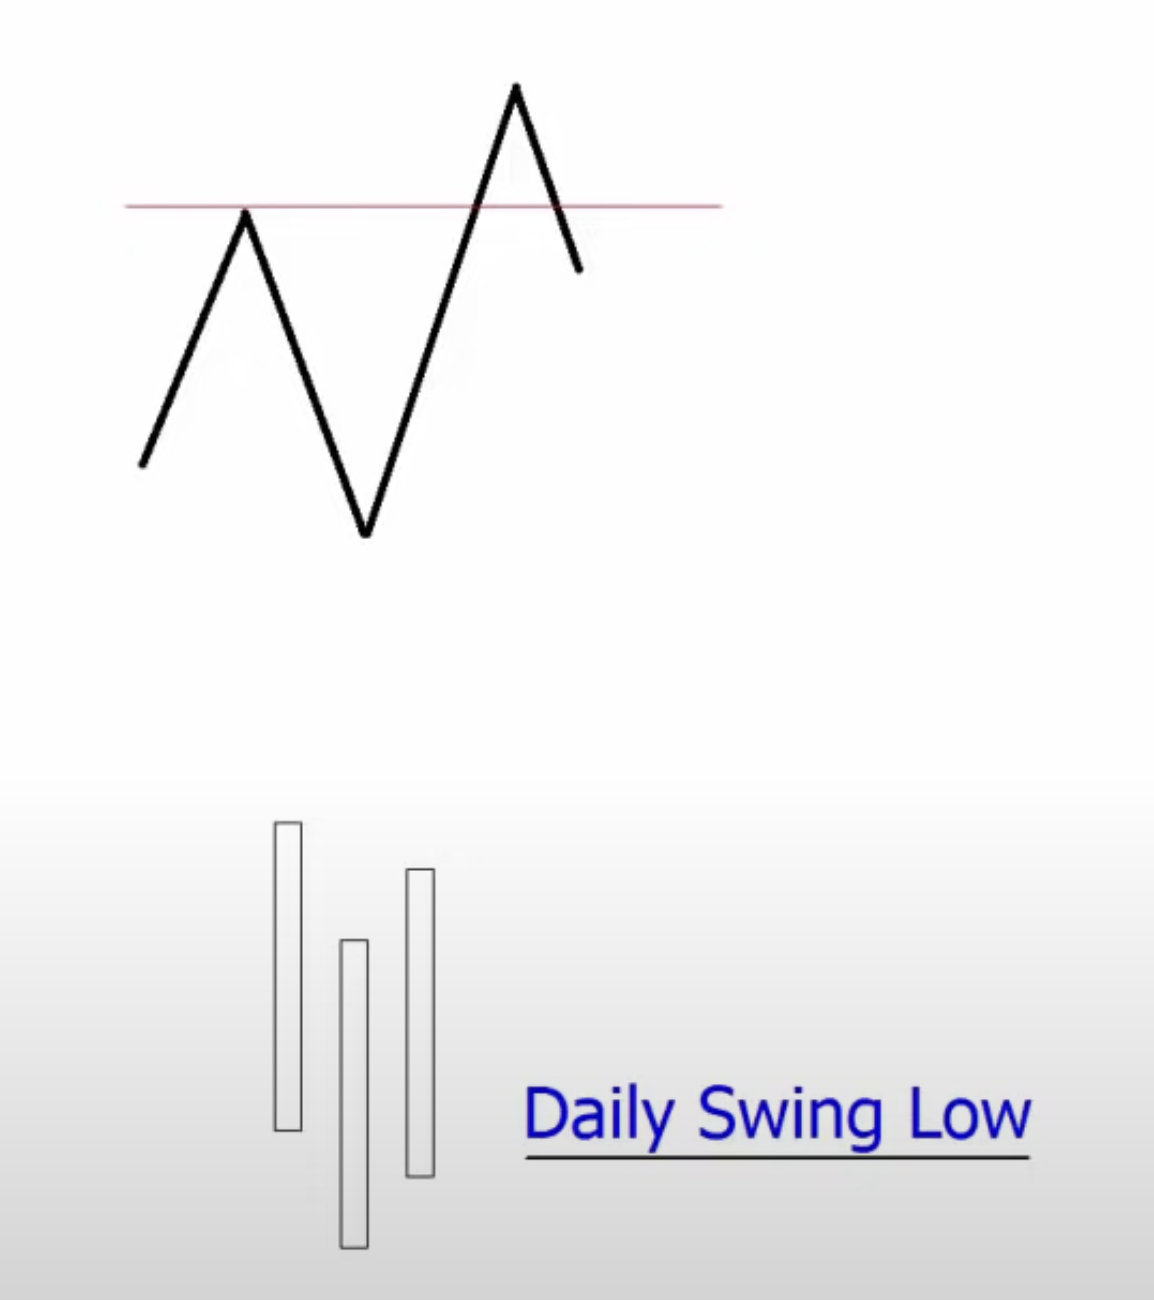
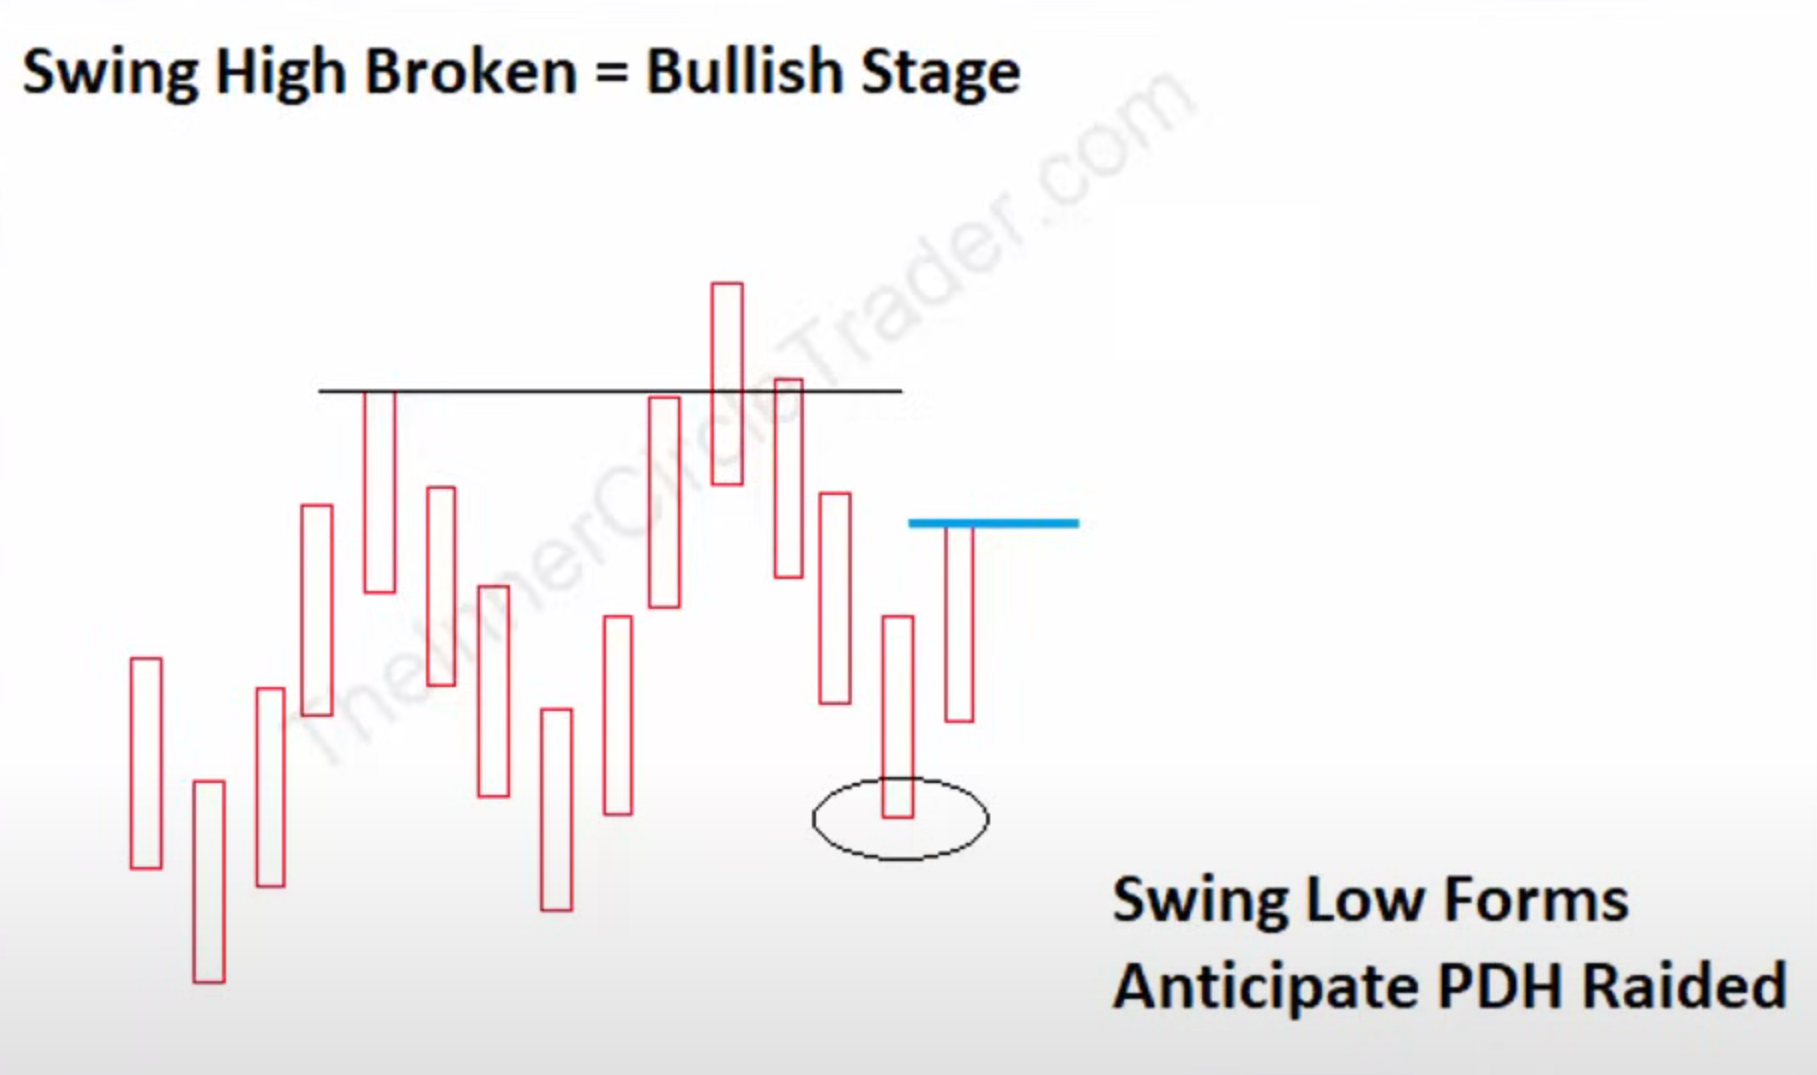
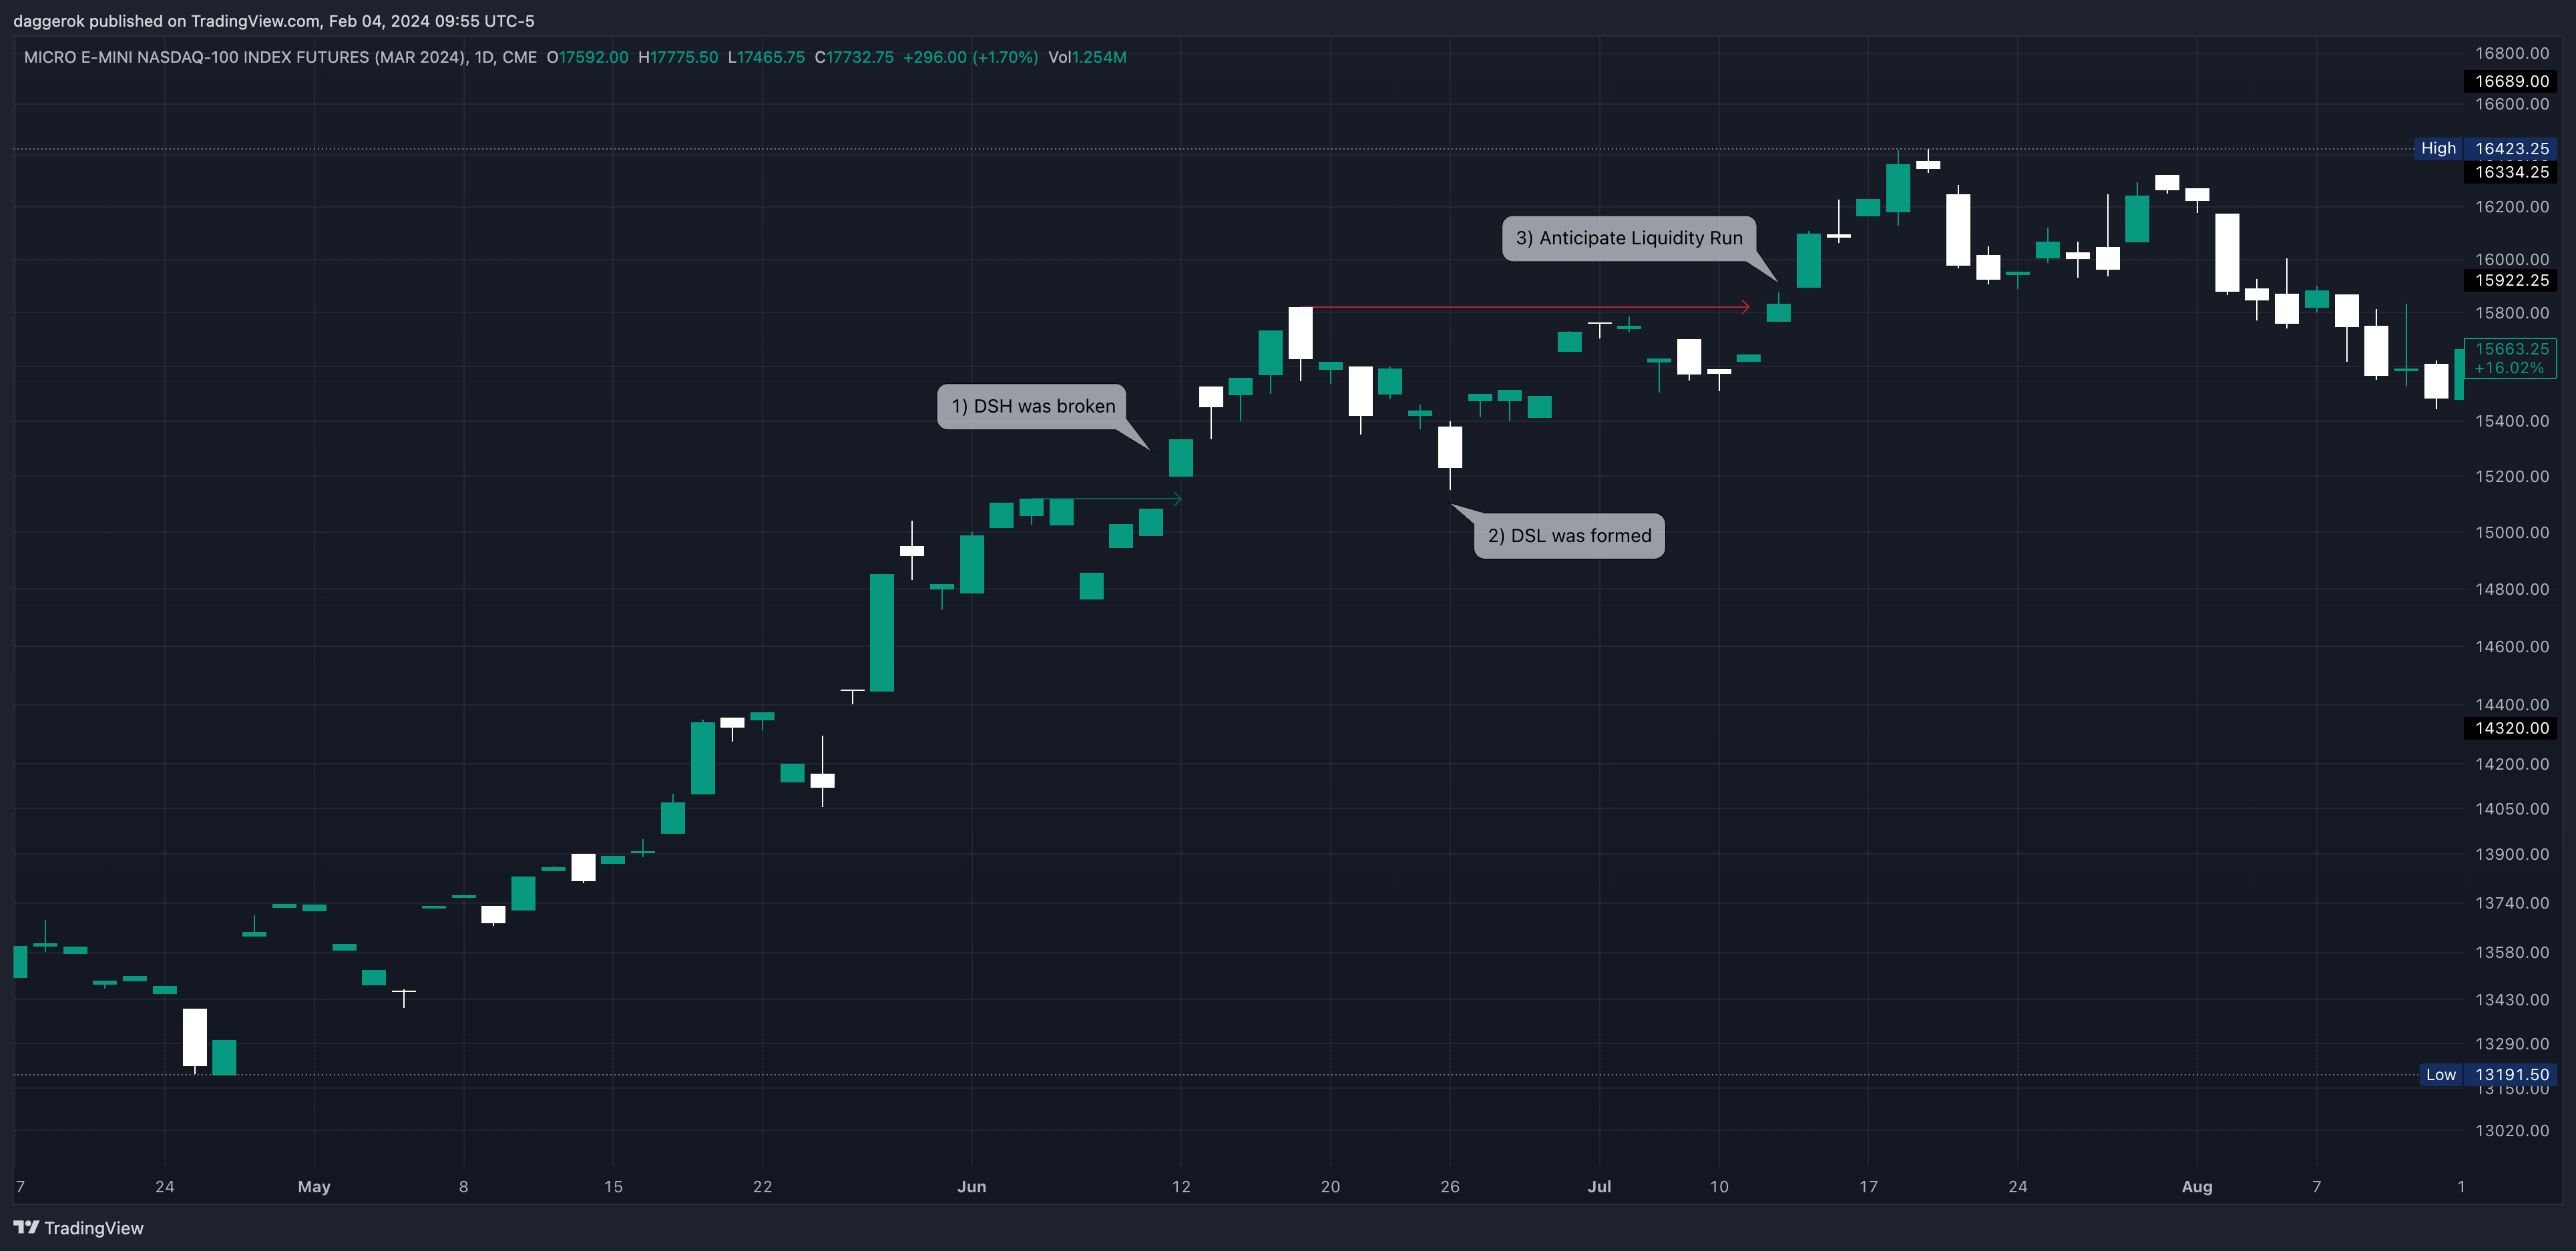
If we are Bullish, we are looking for daily (1D) chart and when we see Daily Swing Low (DSL) formaation - what we are lookibg for is next:
- DSL occur only after previous Swing Daily High (DSH) was broken (like Long Tearm High (LTH) or Short Tearm High (STH)) when that happened:
- We are on a Bullish Alert and our focus is on Last Candle High (Right Candle High), so we wanna see the high be traded through on next day or before that we want to see some retraisment
- Once next day does that - we know that next we will anticipate a run on previous day high liquidity
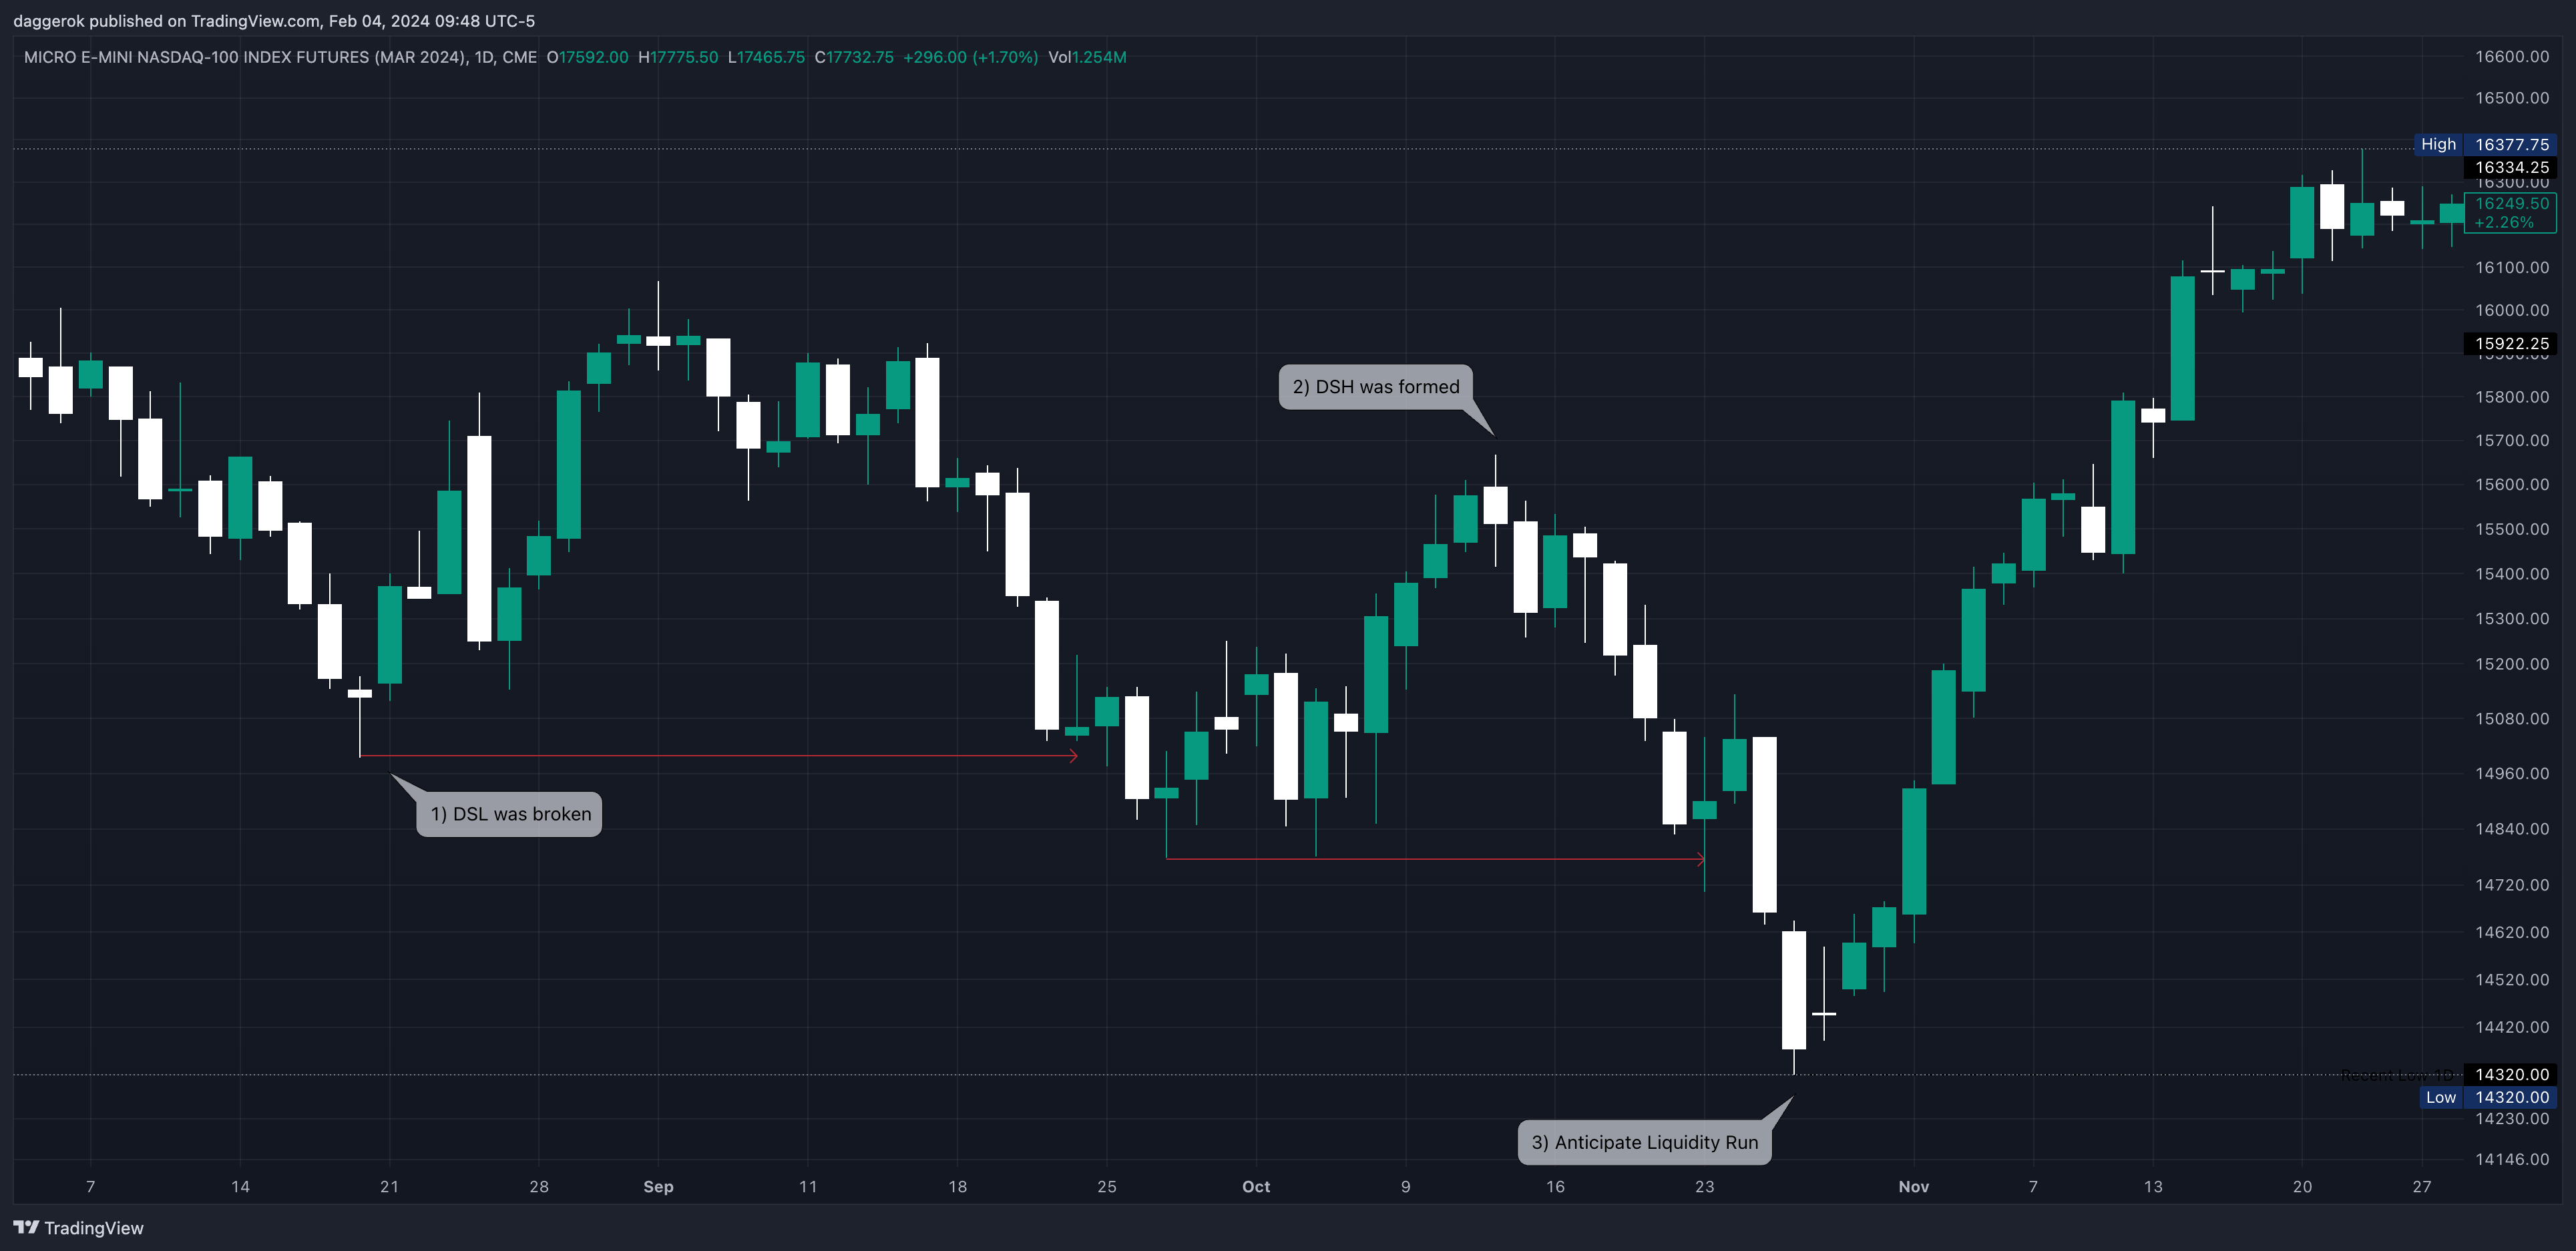
Implementing Bearish Daily Bias
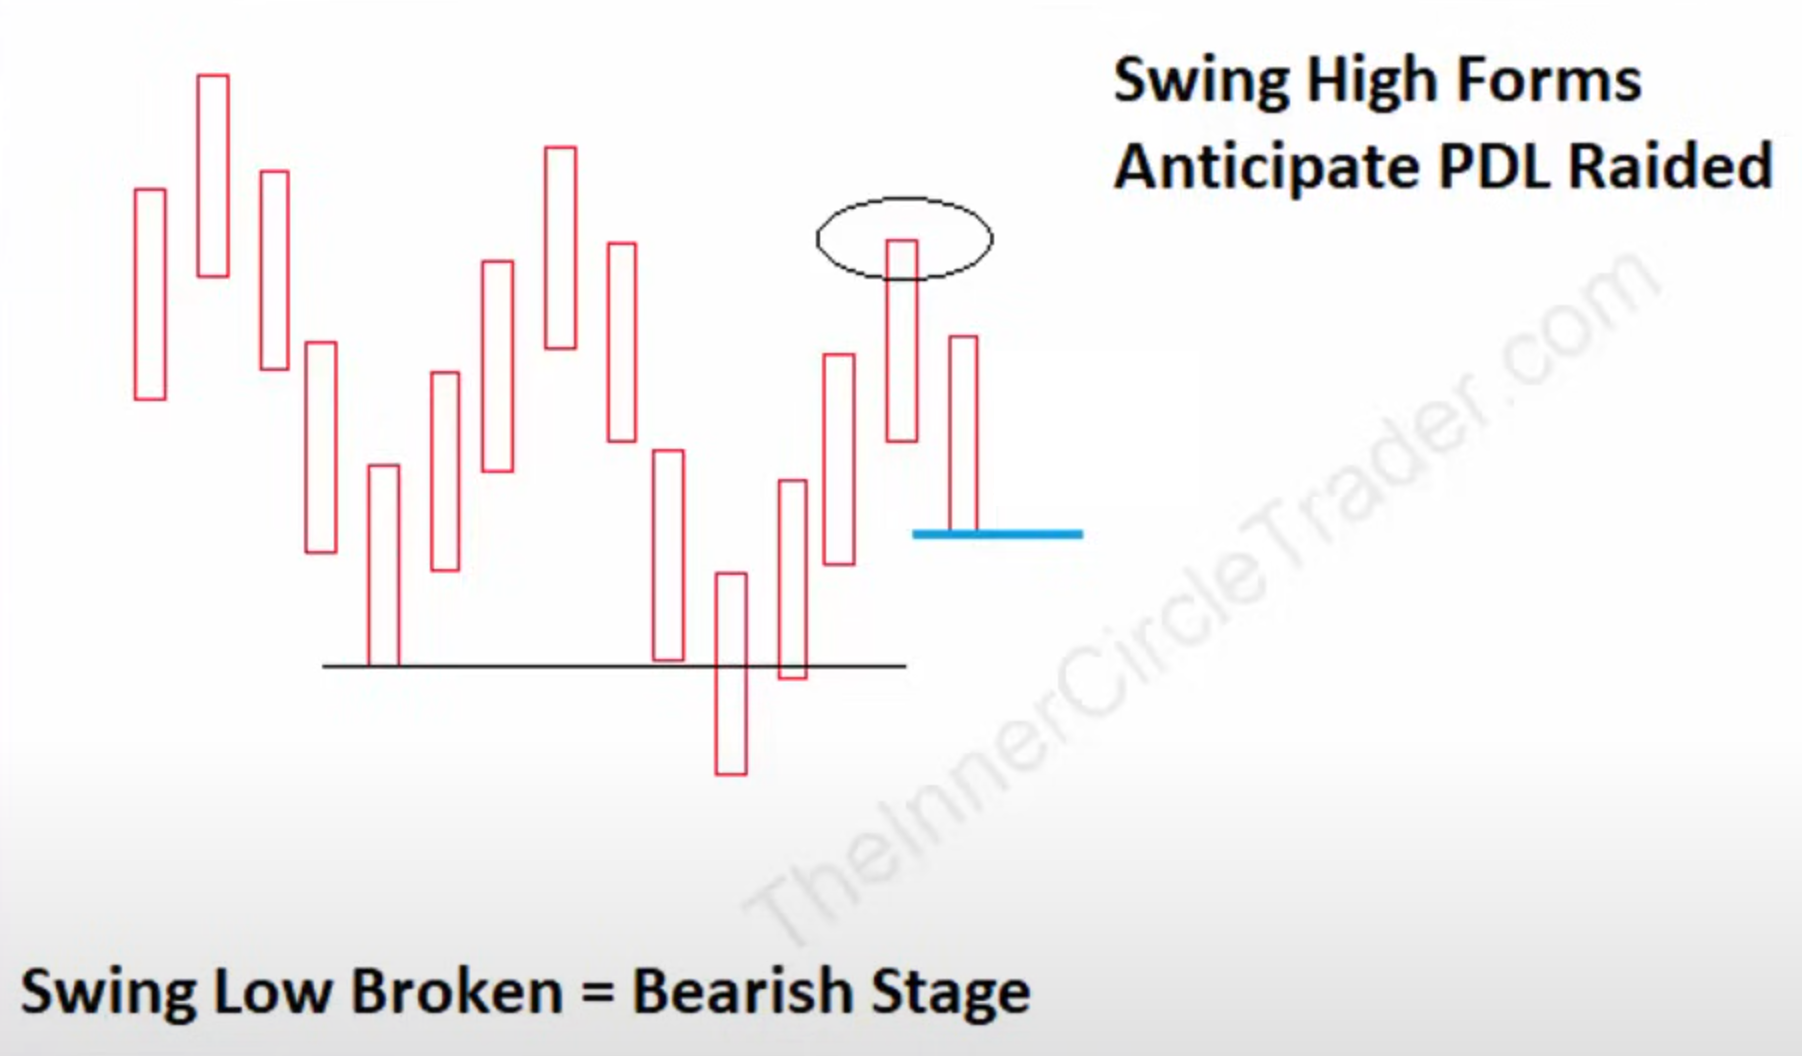
If we are Bearish, we are looking for 1D chart and when we see DSH formaation - what we are lookibg for is next:
- DSH occur only after previous DSL was broken, when that happened:
- We are on a Bearish Alert and our focus is on Last Candle Low (Right Candle Low), so we wanna see the low be traded through on next day or before that we want to see some retraisment
- Once next day does that - we know that next we will anticipate a run on previous day low liquidity
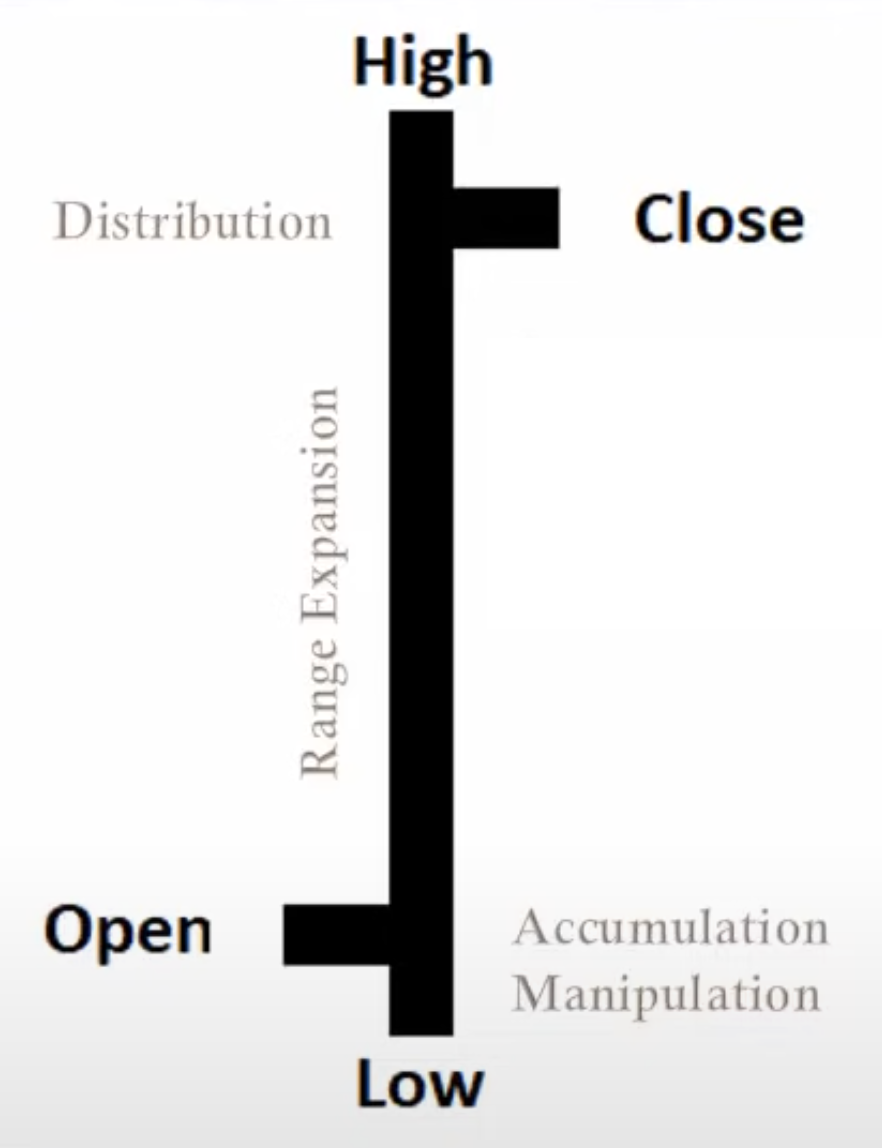
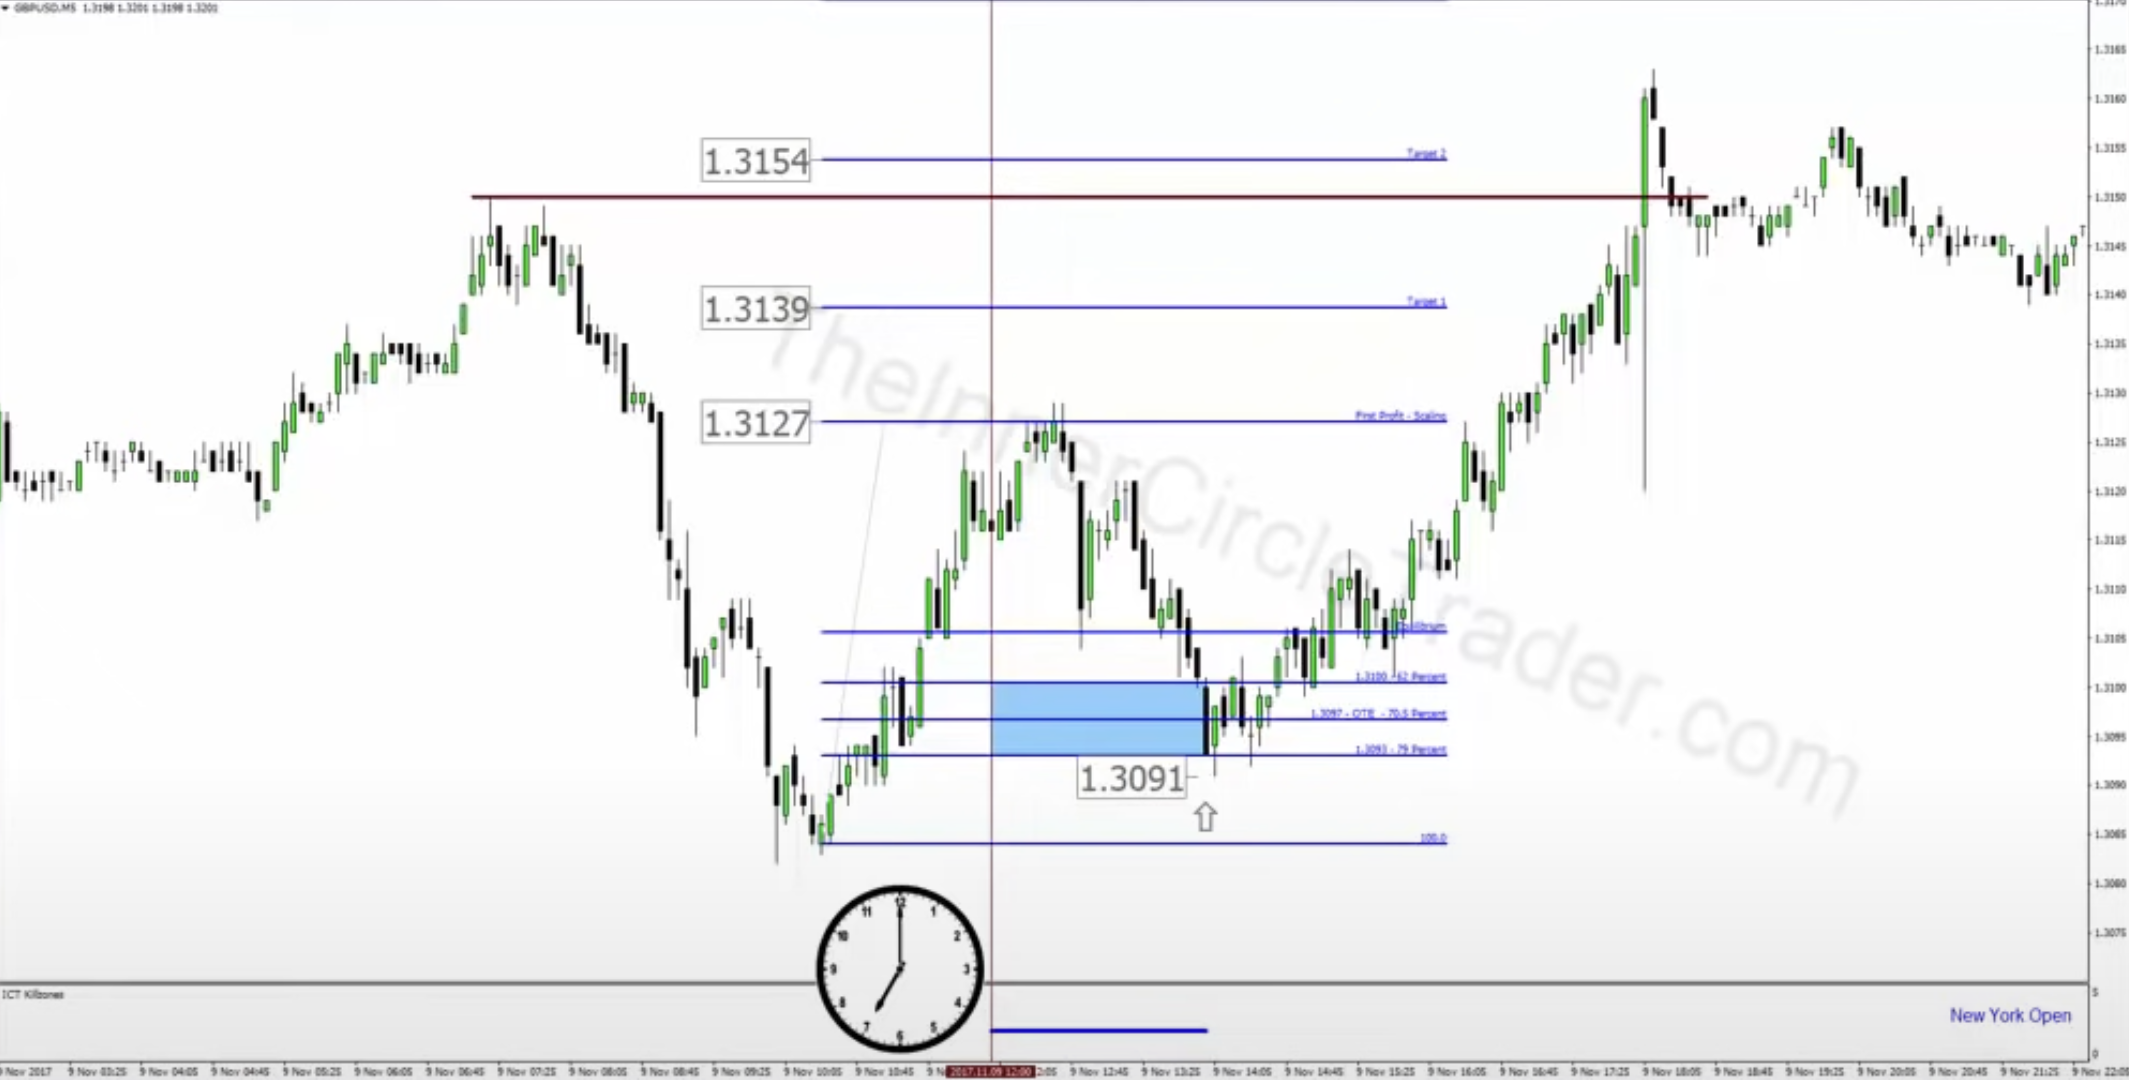
ICT Power Of 3 Concept
Bullish Daily Bias
When The Daily Bias Is Bullish:
- Confirm London session was Bullish
- Wait for 8am New York time to stalk a Long Position
- Between 8am - 9:30am New York time it may form
- After 8am New York time wait for Retracement Lower
- New York session will retrace from the SWH
- Ideally select retracements of at least 20 pips lower
- If no retracement of 20 pips forms by 10am - walk
- If it does form - enter on the 62% fib as it drops down
- Expect price to retest High of Day or a Previous Days High then Targets 1 & 2
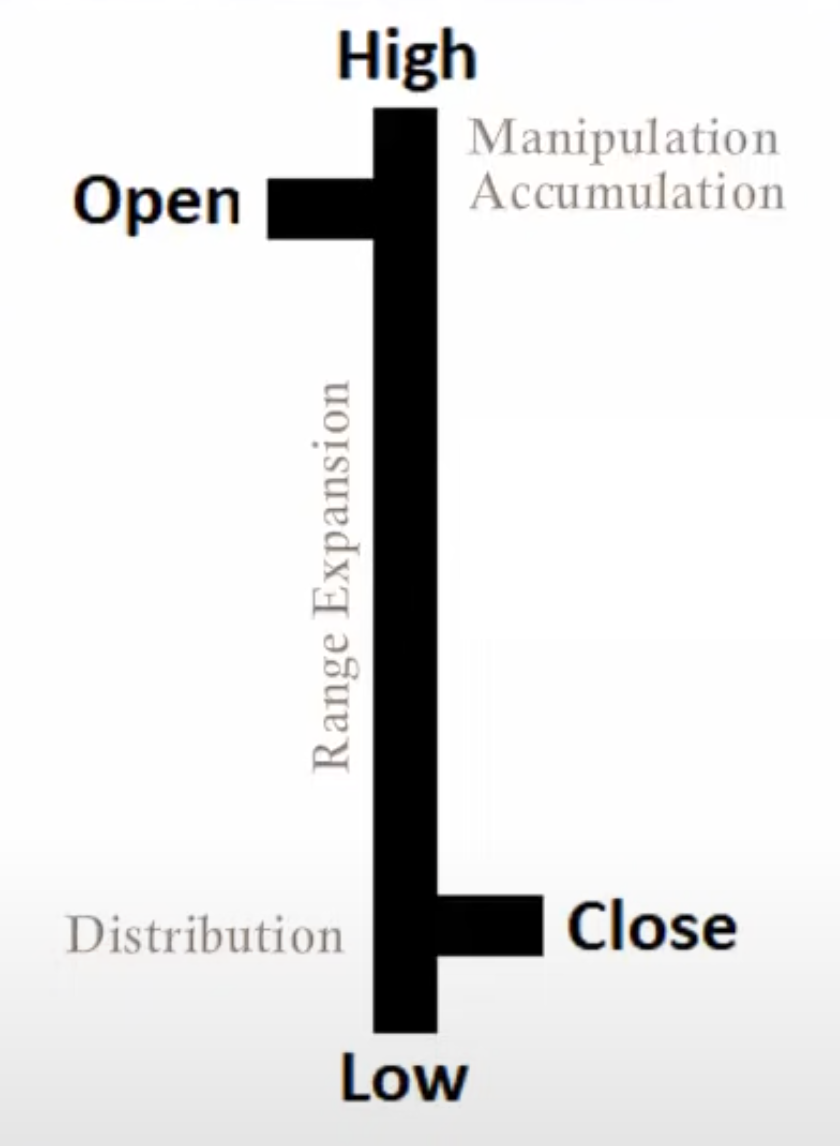
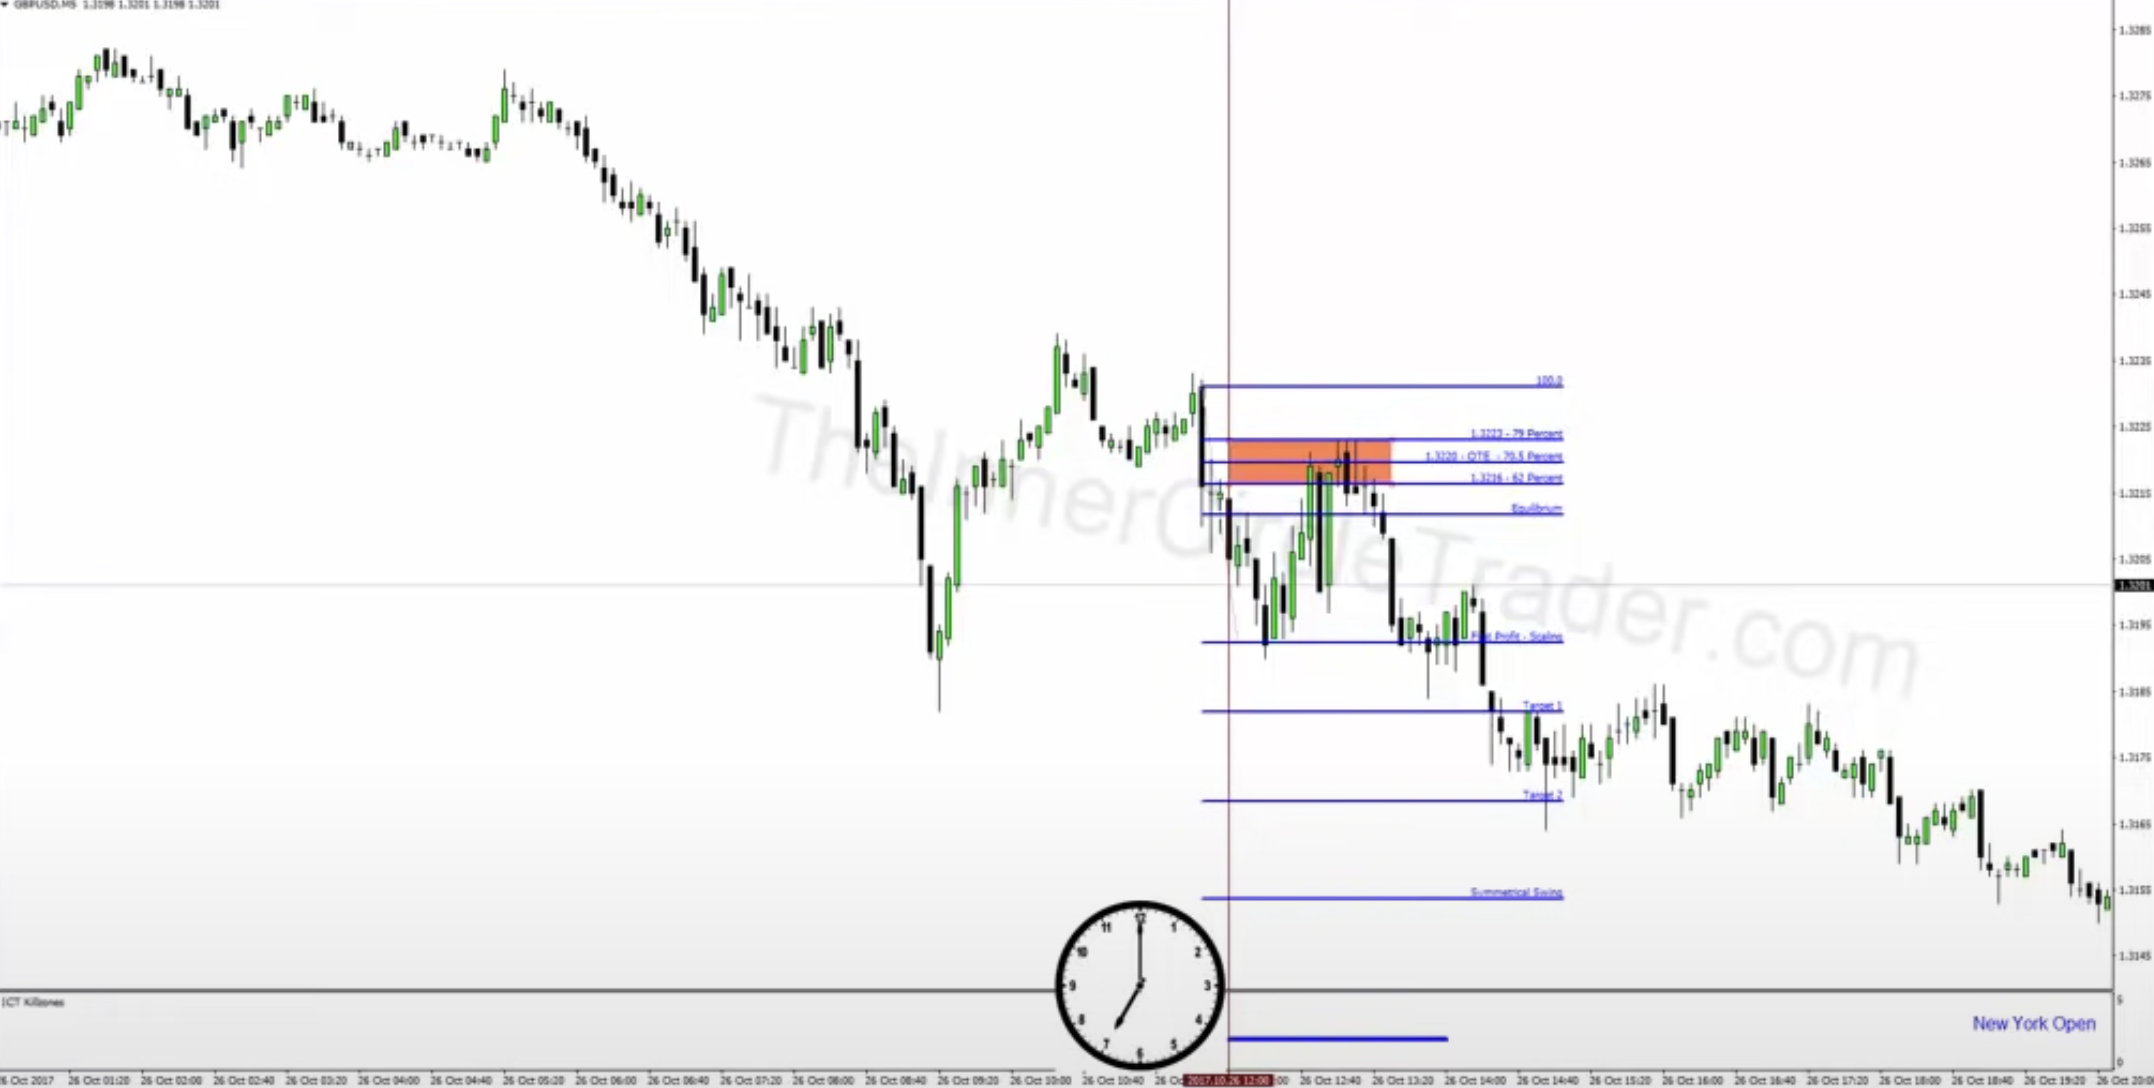
Bearish Daily Bias
When The Daily Bias Is Bearish:
- Confirm London session was Bearish
- Wait for 8am New York time to stalk a Short Position
- Between 8am - 9:30am New York time it should form
- After 8am New York time wait for Retracement Higher
- New York session will retrace from the SWL
- Ideally select retracements of at least 20 pips higher
- If no retracement of 20 pips forms by 10am - walk
- If it does form - enter on the 62% fib as it rallies up
- Expect price to retest Low of Day or a Previous Days Low then Targets 1 & 2
When to expect Reversals?
TL;DR
Higher Time Frame (HTF) will help you to understand that...
- When the Hourly Chart trades to an obvious Old High or Old Low that has shown a clear willingness to reverse Price before... this will likely repeat.
- Sometimes Price will not respect an Old High or Low and these generic Support and Resistance levels will give way and we never really know for sure
- It is far better to expect them to cause a reaction, than not to. There are plenty of moves and price swings between these Key HTF price points to never have to worry about them either!
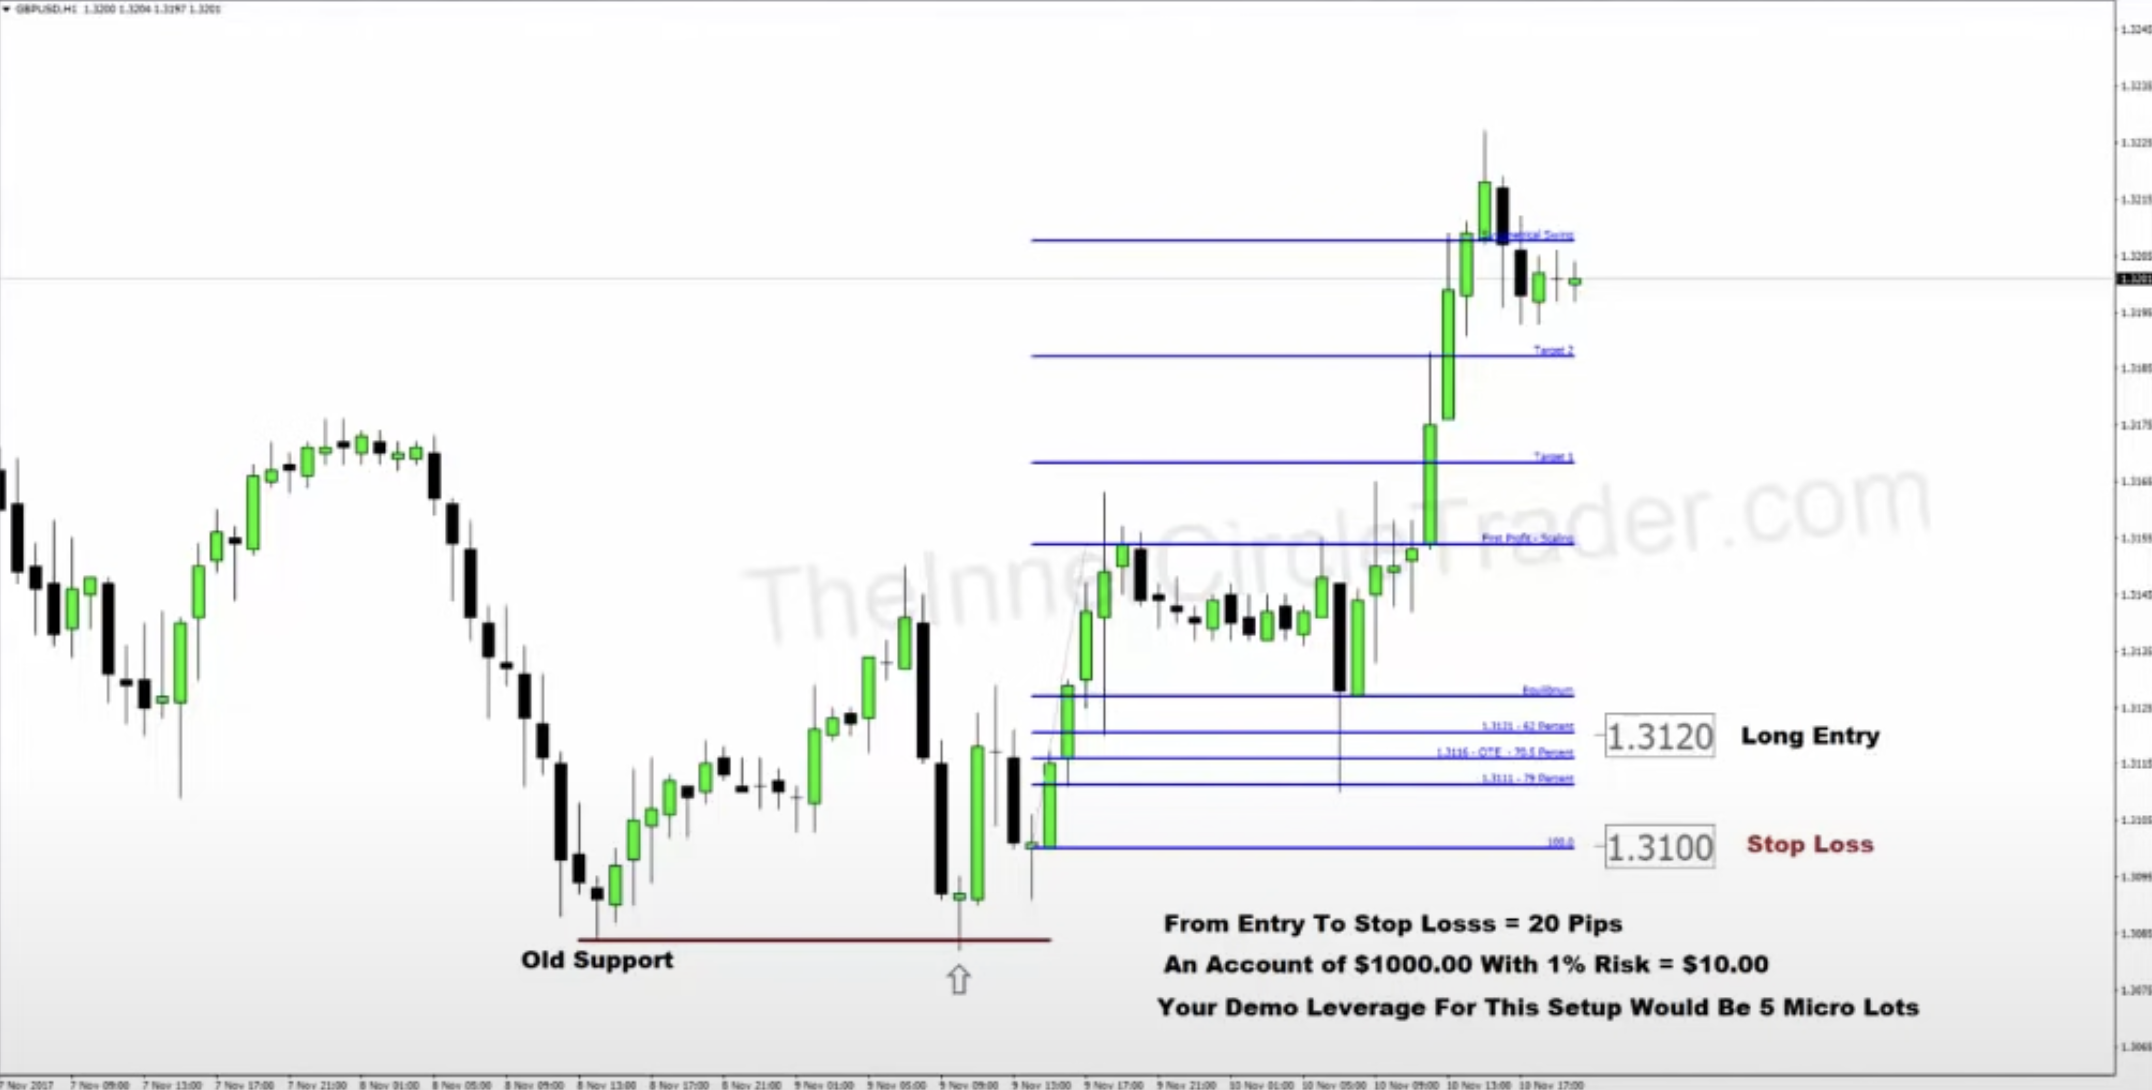
Money Management
- While you develop and practice in your Demo Account - it is important to also implement strict Risk controls
- This is the only protection you have in this business and if you want to see what can be accomplished... you need to use sound Money Management
- Consider using 1% per setup and gradually working your way up to 2% if this meets your "Risk Tolerance". It is important not to try to swing for Home-runs or take larger Risks
- Over-leverage will impede your development and drastically decrease your chances of seeing responsible equity growth
Notes...
When professionals trade?
- In bearish market 70% of time high of the week will be formed on Tue or Wed
- In bullish market 70% of time low of the week will be formed on Mon or Tue
- Do not trade on Wensday, Thoursday and Friday leading up to Non-Farm Payroll (NFP) because ther are is going to be a lot of volatility
- Monday and Tuesday
- Wensday will have big price move if on Tue price was consolidate
Institutional Price Delivery Algorythm (IPTA)
General order in the daily range:
- Consolidation = Asia
- Expansion/Reversal = London (Normally makes the high or low of day)
- Consolidation = Pre-NY (5:00am → 8:00am EST)
- Retracement = (8:00 → 8.30am EST)
- Expansion = NY
- Reversal = NY
- Consolidation = Near/after market close
General order in the weekly range:
- Sunday Open = Consolidation
- Monday = Expansion/Reversal
- Tuesday = Reversal
- Wednesday = Consolidation
- Friday = Reversal/Retracement/Expansion
Seasonality
- SMT Divergence (Smart Money Technique Divergence) is showing a willingness to correct the correlation. Usually it happens
- At 8:30
- Around 9:30 when there are already been nice early run before 7:00 or 8:00
- At news events beign released And if we have a bias then it's healpful: For example we are bulish and NASDAQ did a lower low but E-MINI S&P 500 - a higher low, then we shouldn't trade NASDAQ, but S&P 500 because its not likely to go lower, but higher
- On a daily timeframe charts we are looking for SMT divergence between all these 3 Indexes:
- NASDAQ
- S&P 500
- DOW
- In spring in between Apr and May we are looking for Bearish SMT divergence when one of these indexes will not be able to form higher high. Once that happened we are hunt for ICT 2022 Mentorship Bearish Model
- In autumn (fall) in between 3rd week of Spe and 3rd week of Nov we are looking for Billush SMT divergence when one of these indexes will not be able to form lower low. Once that happened we are hunt for ICT 2022 Mentorship Bullish Model
- Weekly bias. On a weekly chart (preferably before week start) we should think of where weekly candle should go higher or lower. It depends on FED how ots gonna rase interrest rate (Stock markets doesn't like that). If we are in a earching season, then there are a lot of valotility because of earnings. All this factors - are drivers to where is market is going to go, up or down to drawing a liquidity or deliver price effectively to some previously formed FVG. So the only thing we are looking for is a likly movement higher or lower based on a weekly candle
- Daily bias. On a daily chart we are lookling for swing highs and swing lows to get your liquidity . Major treading time to looking for reasons what makes market go higher or lower will be found on that TF (time frame). We wanna see every STL (short teram low) which is going to be a sell stops on a bearish bias or buy stops on a bulish bias. Market is always drawing one of these things:
- its drawing to stops, which is liquidity, or
- its running to imbalance (FVG)
Killzones
- Asia: 20:00-00:00
- London: 02:00-05:00
- New York AM Session: 8:30-11:00 (FX pairs: 7:00-10:00)
- New York PM Session: 13:30-16:00
- New York Last 1 Hour of PM Session: 15:00-16:00
Silver bullet
- London SB: 03:00-04:00
- New York AM SB: 10:00-11:00
- New York PM SB: 14:00-15:00
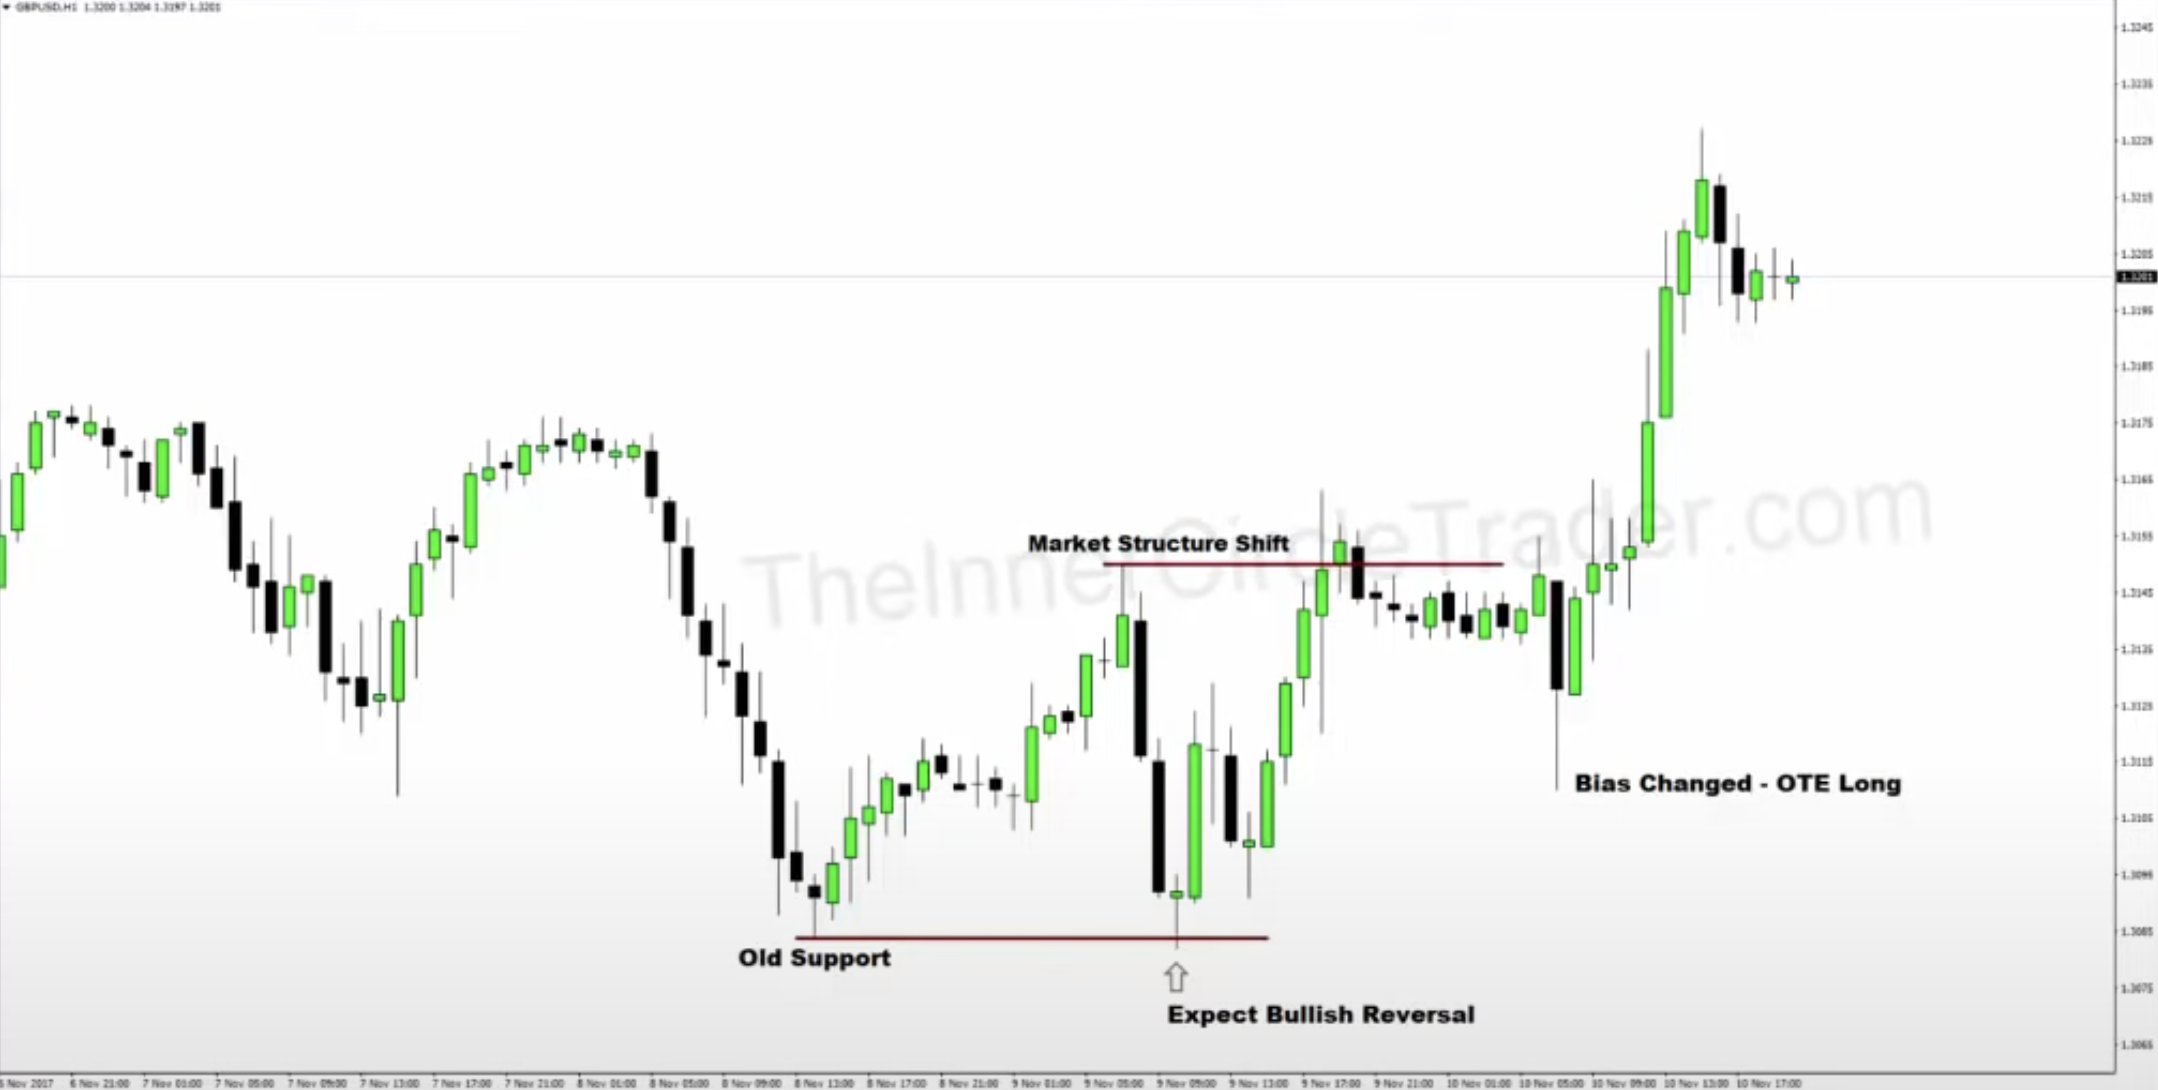
Internal range liquidity & Market structure shift
Glossary and acronyms
- Buyside Liquidity (BL) - its Buy Stops (BS) retail traders put above Old High (OH) or above Short Tearm High (STH)
- Buyside Imbalance Sellside Inefficiency (BISI)
- Buy Stops (BS). Stops below BL Retail Trader idea of support level on long positions, lower than old low
- Sellside Liquidity (SL) - its Sell Stops (SS) retail traders put below Old Low (OL) or below Short Tearm Low (STL)
- Sellside Imbalance Buyside Inefficiency (SIBI)
- Sell Stops (SS). Stops above SL Retail Trader idea of resistance level on short positions, higher than old high
- Consequent Encouragement it's a middle of the gap
- Regular Trading Hours (RTH). Hours when algorithm is delivering price to SMT
- Electronic Trading Hours (ETH). All available trading hours on a chart
- Liquidity Viod (LV). Gap between two candels where no trading at all, for example between NWOGap High and NWOG Low
- Market Sructure Shift (MSS). Bullish MSS, Bearish MSS
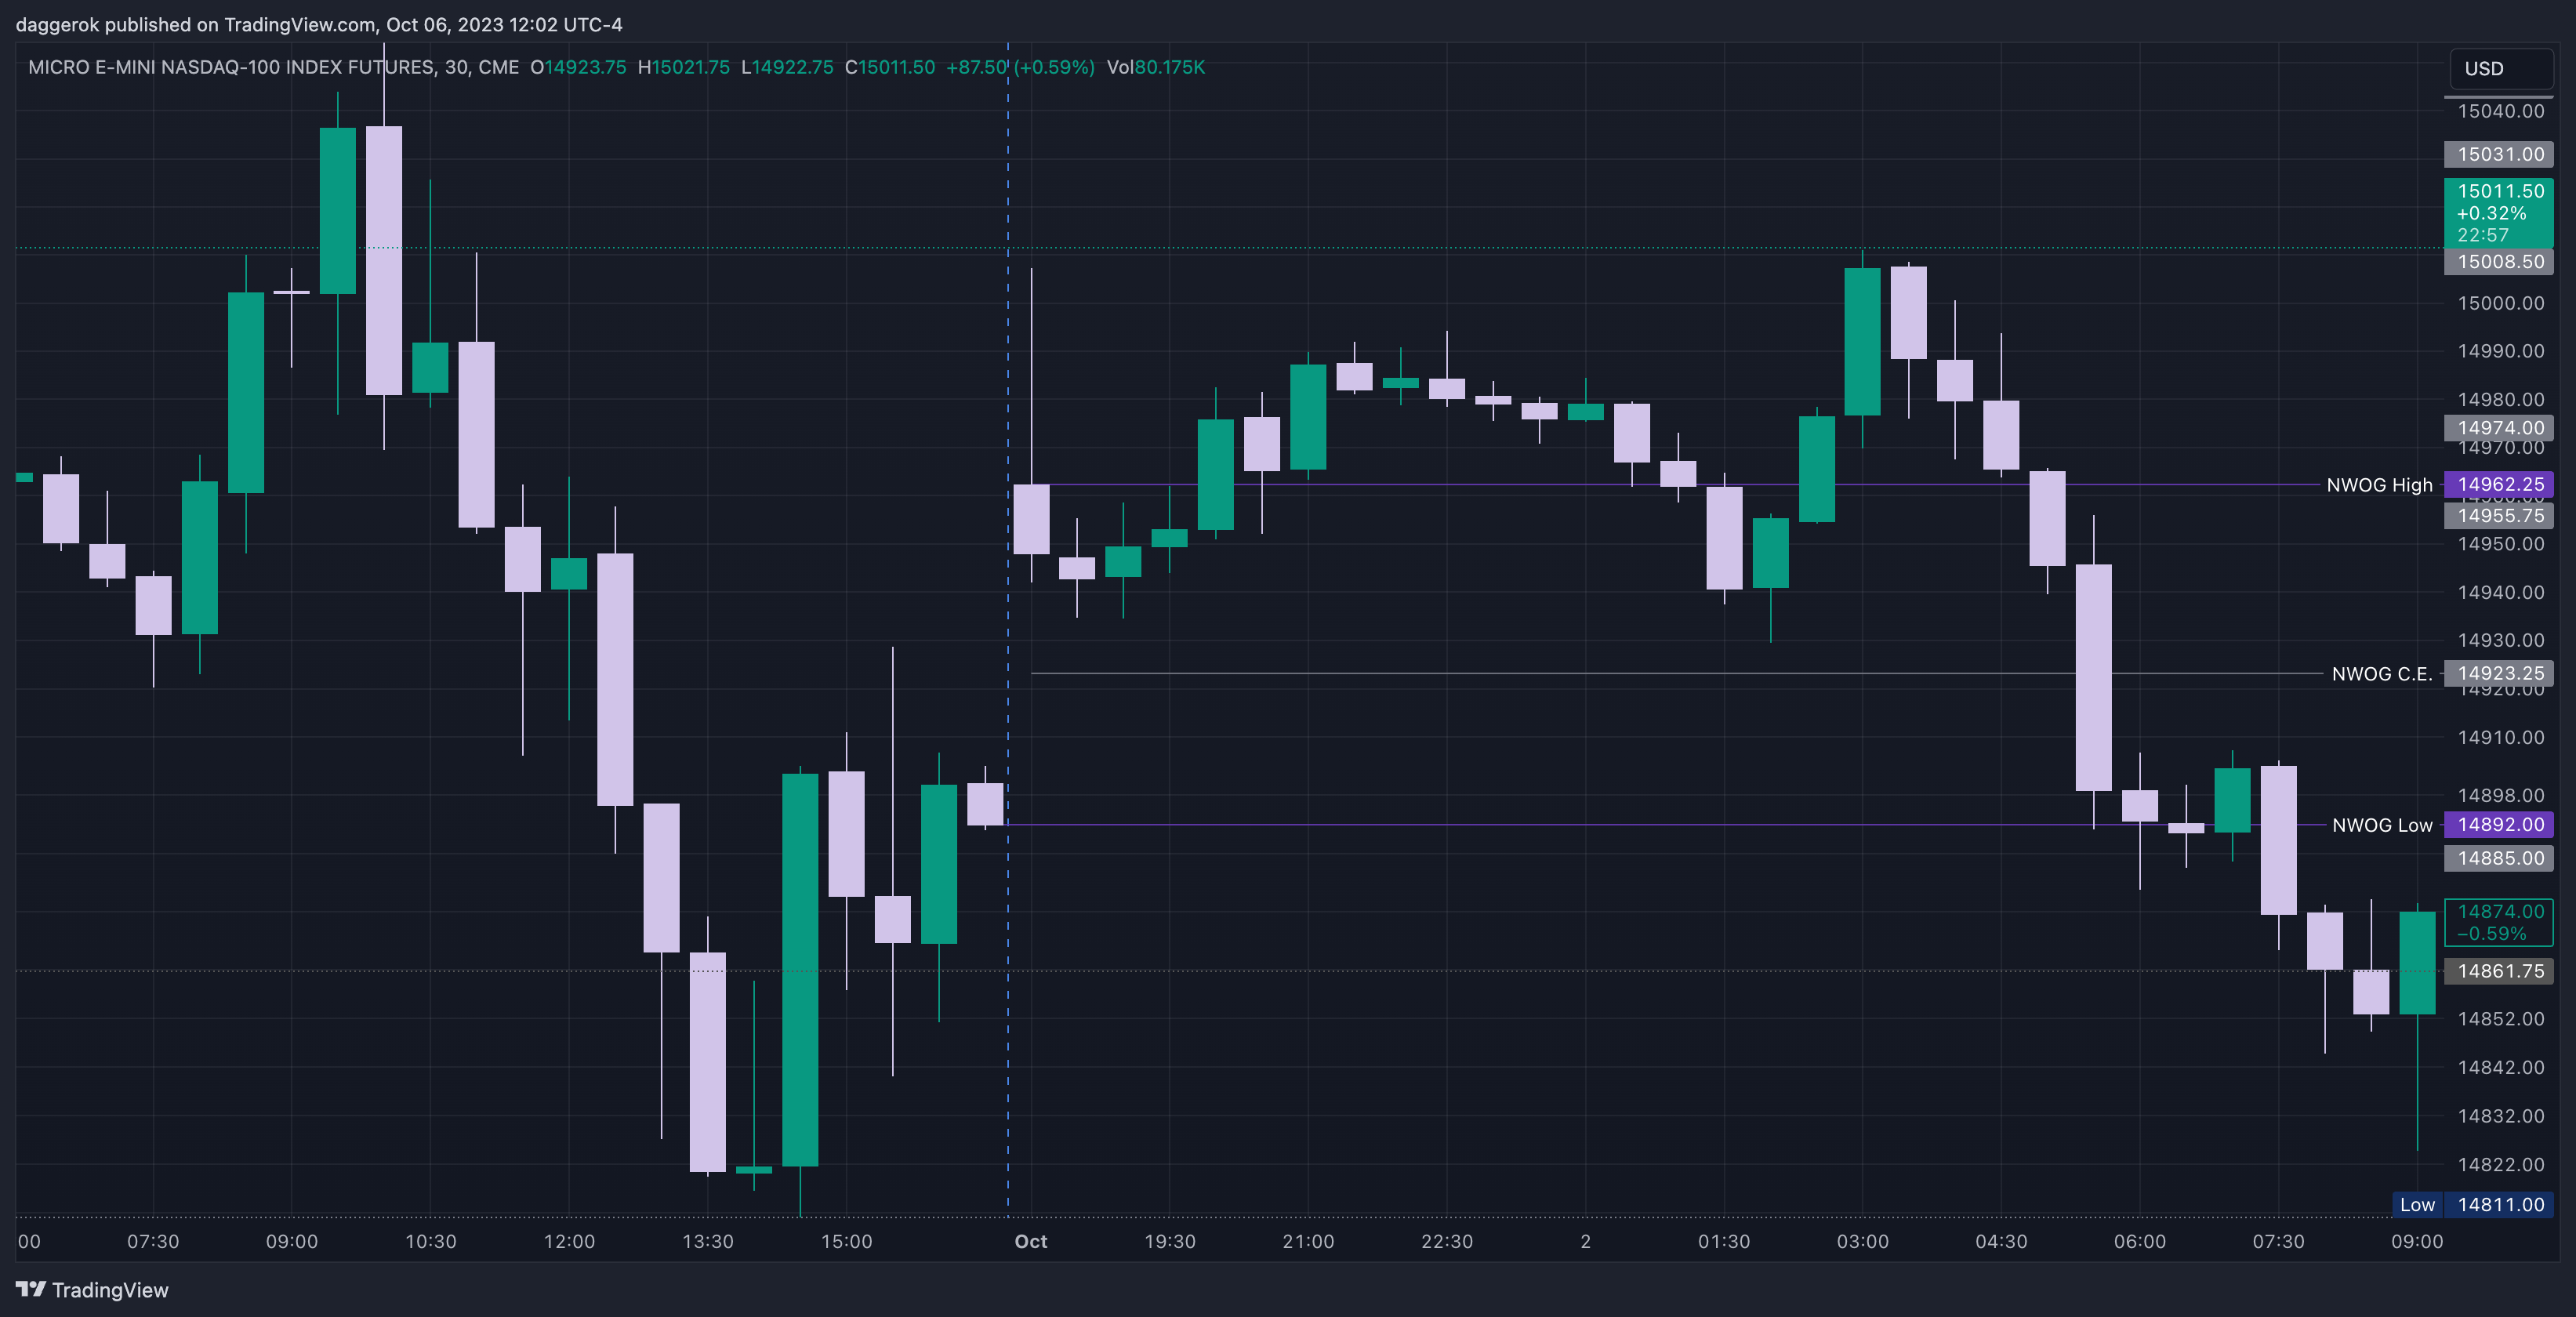
- New Week Opening Gap (NWOG). Gap between close price of previous Friday at 4:30pm and open price of previous Sunday at 6pm
- New Week Opening Gap High (NWOG High). Example: Sun 01 Oct '23 6pm
- New Week Opening Gap Consequent Encouragement (NWOG C.E.). Mid point of the NWOG
- New Week Opening Gap Low (NWOG Low). Example: Fri 29 Sep '23 4:30pm
- New Day Opening Gap (NDOG). Distance between 5pm and opening 6pm
- Opening Range Gap (ORG). Where we have relation between RTH
- Opening Range Gap Settlement (ORG Settlement). Previous day close price on RTH. Word Settlement is going to be changed in a moment where market price is opened at 9:30am... If current price is opened above ORG Settlement, then we should change ORG Settlement to ORG Low, otherwise ORG Settlement must be changed to ORG High as far opening price is under the RTH previously closed price
- Optimal Trade Entry (OTE) using Breaking Market Structure
- Old High or Old Low is a first nearest Swing High or Swing Low you can found going back on a chart starting from current candle. If there are any other importants like Fair Value Gap or Volume Gap on a chart exists near that Old High / Old Low, then we should watch our trade range in between that and current candles highs and lows current candle and candle with
- Silver Bullet (SB). 1-hour time interval where a FVG can be touched: 10am-11am, 1pm-2pm
- Smart Money (SM)
- Smart Money Concepts (SMC)
- Smart Money Traders (SMT)
- Stop Raid (SR)
- PM Trading Session - 14:00-16:00 time interval (from 2pm till 4pm)
- Final Hour Of PM Trading Session - 15:00-16:00 time interval (from 3pm till 4pm) where is possibility of price action move in the end of the day. If you don't have a setup by 10 minutes to 4 then don't do anything. Usually setup should appear in between 15:15-15:45 little tiny small sweet spot where I'm looking for liquidity (above the marketplace if I'm bulish or below marketplace if I'm bearish) or if there is an imbalance (BISI if I'm bulish, SIBI if I'm bearish)
Rules
Before trade always check highs and lows marker could sweep above or below for Stop Raid:
- Asian session in between 7pm-9pm
- London session in between 2am-5am
- New York session in between 7am-10am
- And finally intrady just before 9:30am
Trade from Monday till Friday:
- From 8:30am (or 9:30am depends on year time) till 12pm
- From 1-1:30pm till 4-4:30pm
Do not trade on Thursday and Friday in between 8am and 10am
FVG with OTE is significant only if before it we traded into Sellside Liquidity or Buyside Liquidity meaning that is should be traded under Retail Trader idea of support level / double bottom or it should be traded above Retail trader idea of resistance level / double top / head and sholders, etc...
Every gap or inefficiency should be delivered (filled) with both up and down price actions. So if Buyside delivery (when marked goes up) occurred it reasonable expect that later Sellside delivery is also going to be done eventually
In most cases in 8:30am when news are came out the first run whatever that direction is in price that is the fake move - that is a first stage delivery. The second stage is the opposite is whatever that is meaning we will see price do reversal. For example:
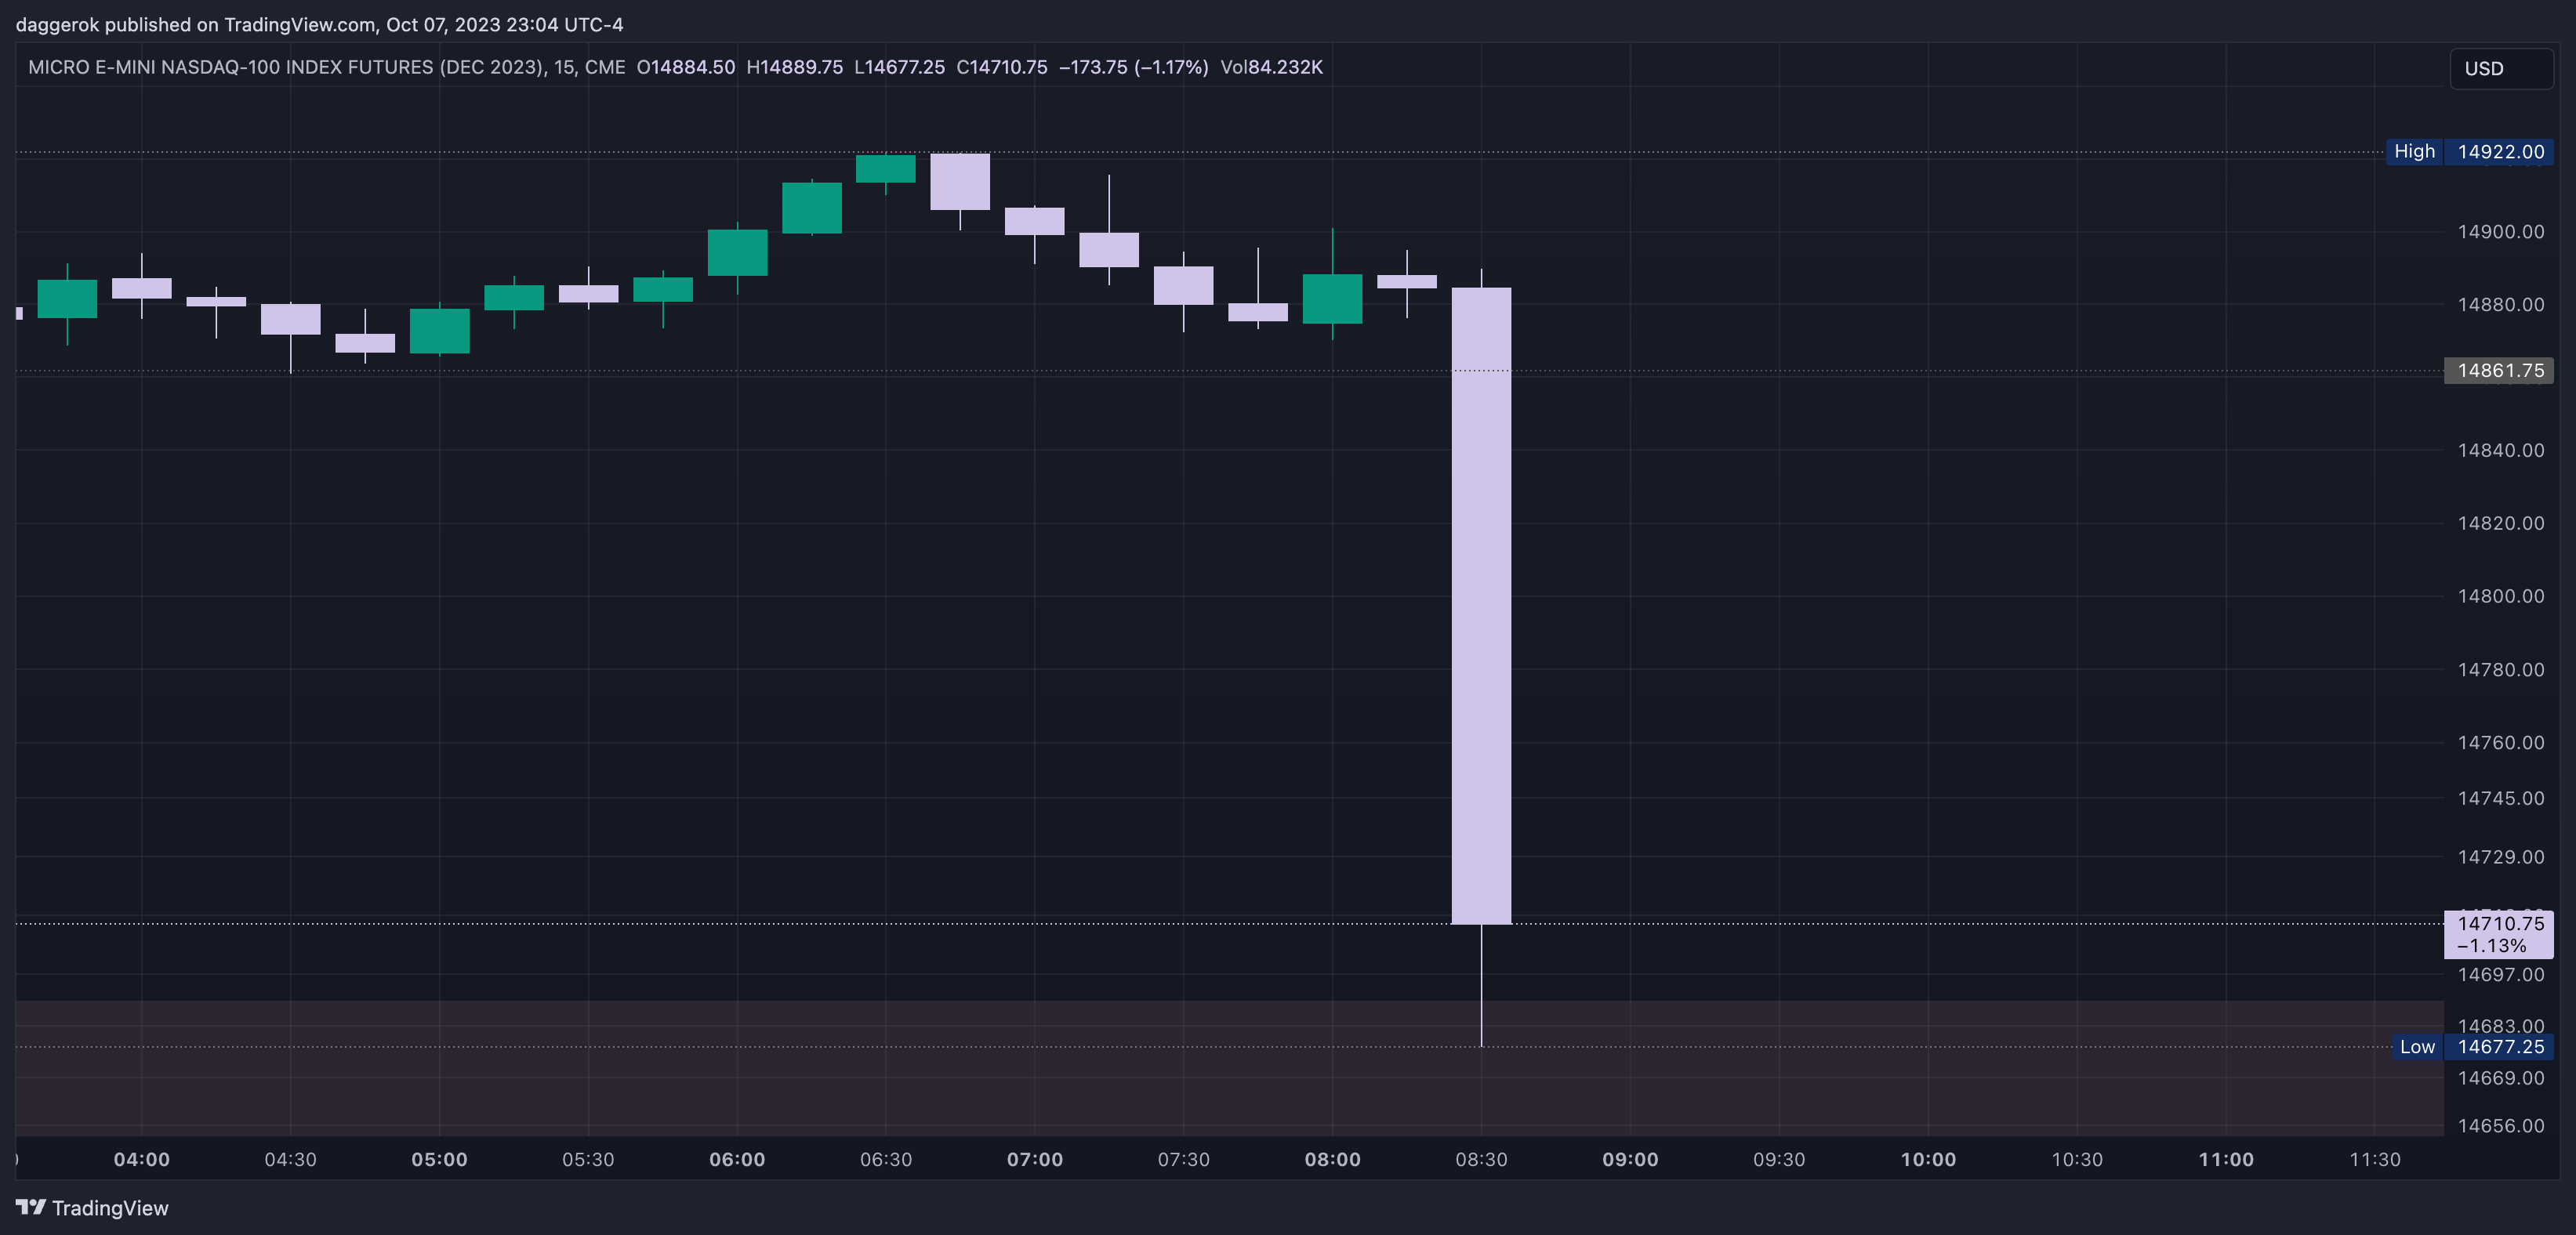 Here everybody thinking: "okay, it's going to go lower" and it's crashes everyone that's already in long... And it did so in stunning fashion very quickly, which scares everyone in a marketplace, it terrifies them! ...Then the market does a second stage: what the 8:30am news sentiment shift caused everyone to think that it would keep going lower and keep going lower... They trapped them short, and then they run against the move that took place in the morning:
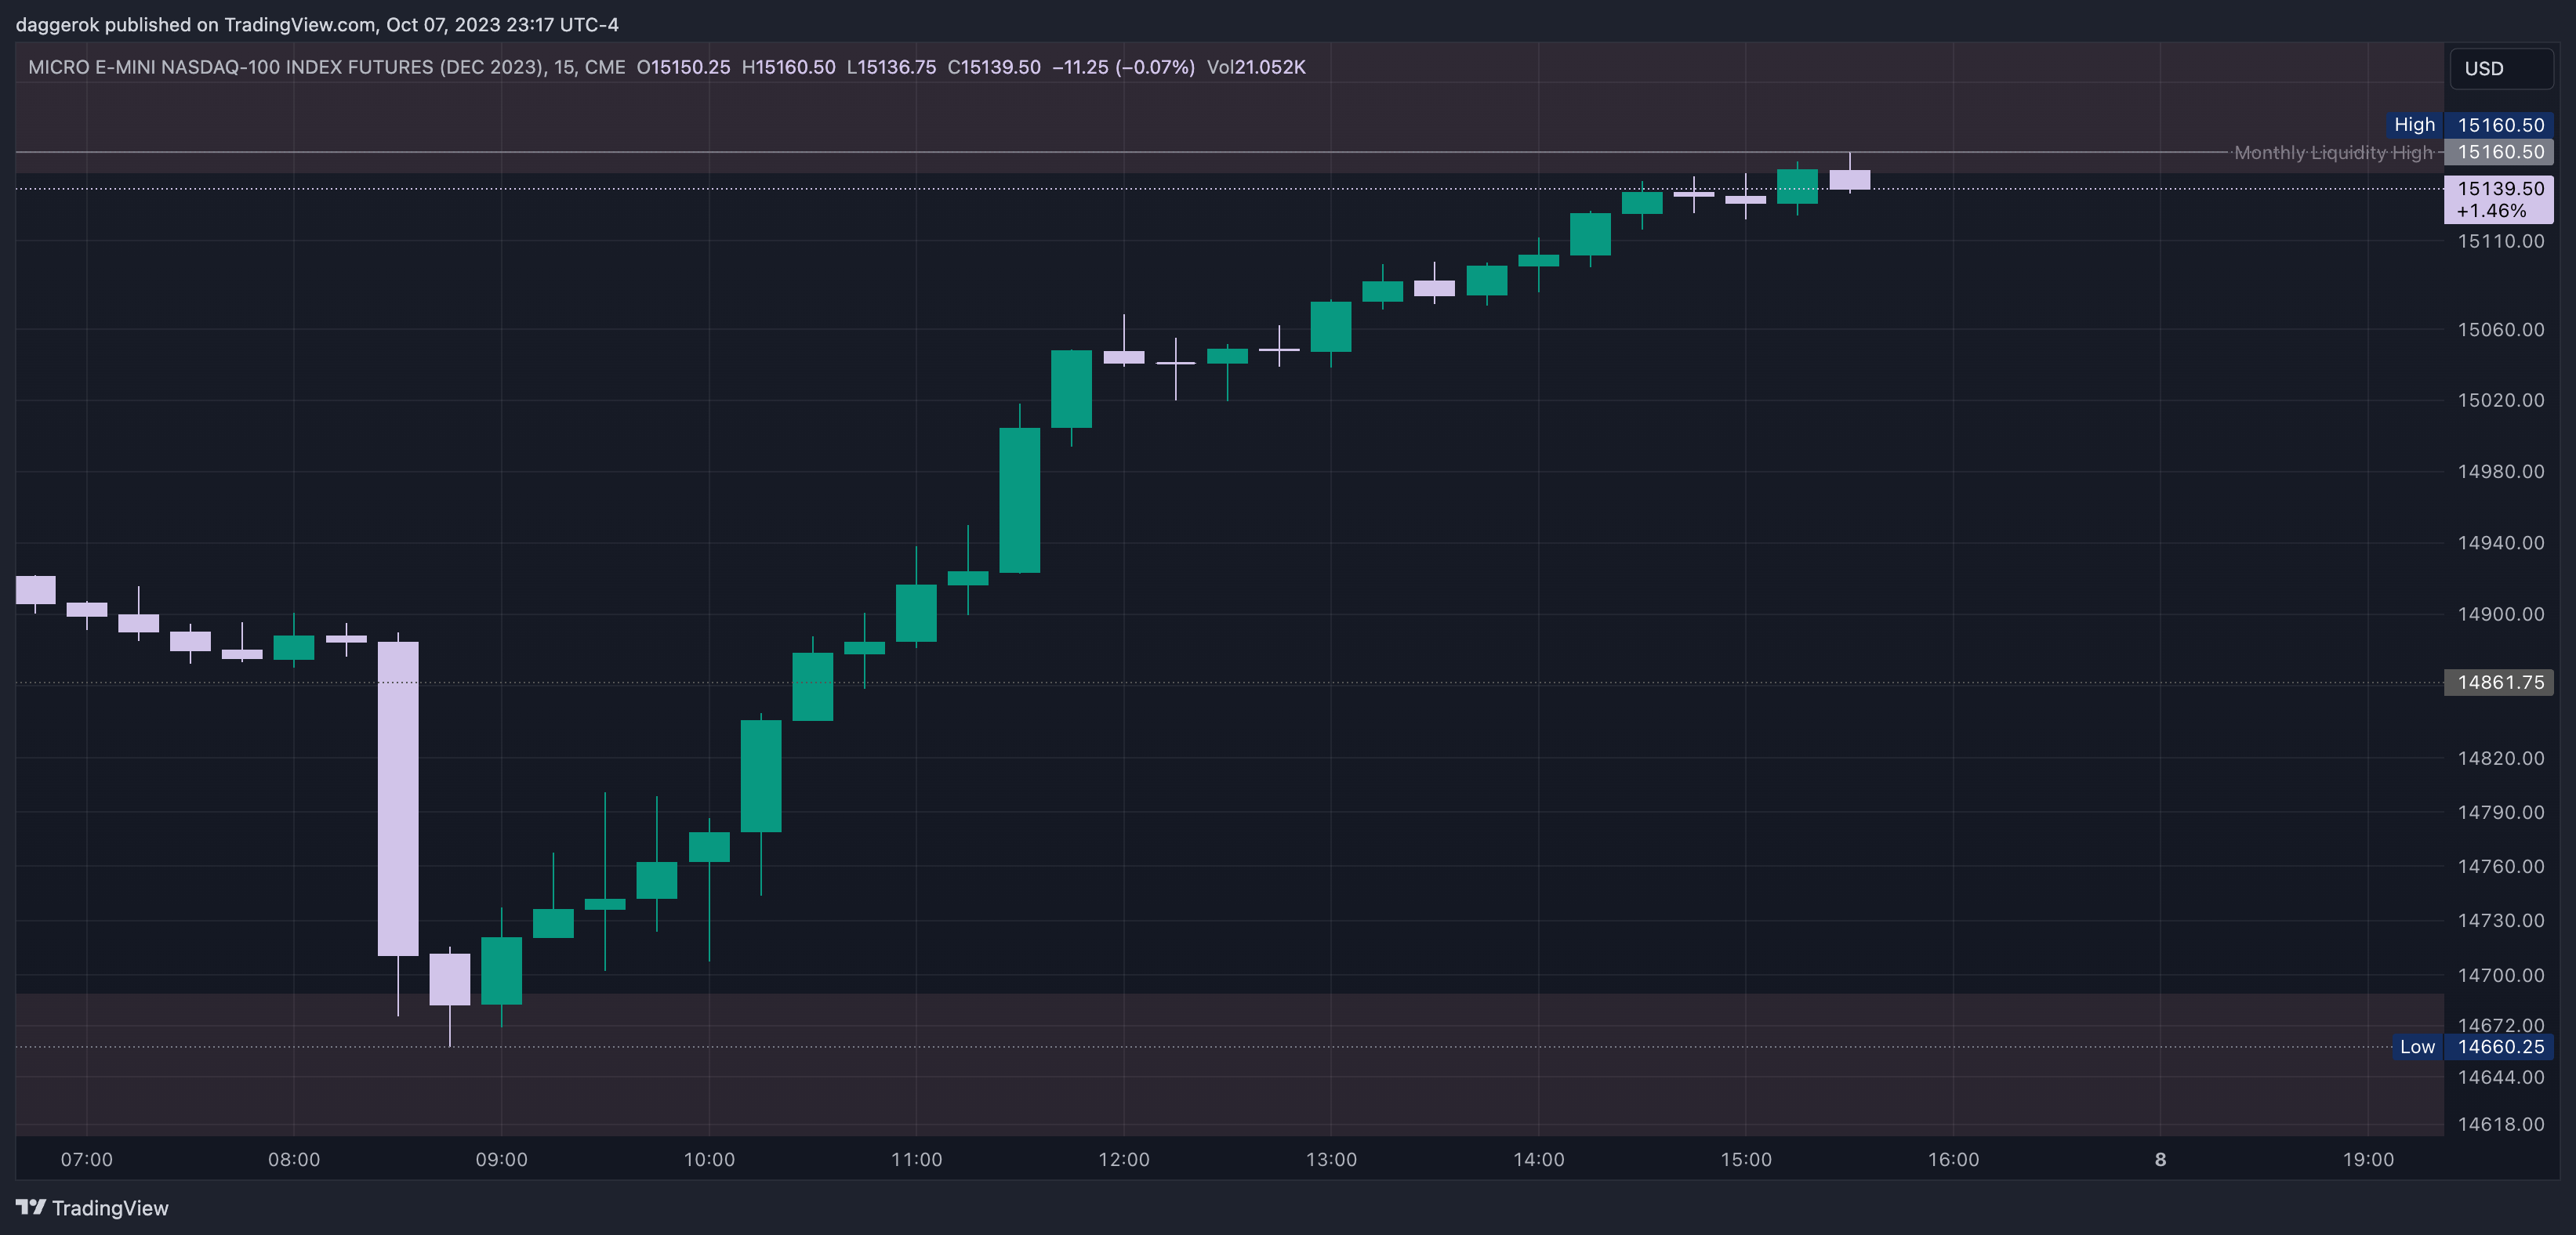
NWOG
New Week Opening Gap
How to define Opening Range Settlement and Opening Range Gap
- Enable RTH
- Mark with horiszontal line prev. Friday close 16:14pm price - Opening Range Settlement
- As soon Market open 9:30am price appears then mark ractangle with consequent encouragement line from horizontal price to Market open 9:30am price. Consequent encouragement line - Opening Range Gap
- If Market open 9:30am price will be higher than Friday close 16:14pm price then Opening Range Settlement becomes Opening Range Low
- If Market open 9:30am price will be lower than Friday close 16:14pm price then Opening Range Settlement becomes Opening Range High